

A revenue cycle director can watch collections hold steady for two quarters and still be losing money every week. The dashboard may show familiar volumes, a tolerable denial count, and no dramatic change in total cash. Meanwhile, one payer has reduced payment on time-based anesthesia services, coding teams are missing units, and unresolved accounts are aging outside the normal workflow.
That's why performance benchmarking matters. A month-over-month report tells you whether your own results moved. A properly designed benchmark tells you whether the movement is meaningful, whether a payer is treating your claims differently from comparable claims, and whether your data can support an underpayment dispute. For specialty groups, the strongest benchmark isn't a colorful scorecard. It's a reproducible operating record that connects claim performance, payer behavior, workflow ownership, and Independent Dispute Resolution (IDR) evidence.
The Revenue Cycle Problem You Cannot See Without Benchmarks
A mid-size anesthesia group closes its second quarter with collections roughly where leadership expects them. The RCM director sees no obvious crisis. Encounters are stable, staff productivity looks consistent, and the monthly dashboard doesn't show a sharp denial surge. The team accepts flat performance as normal because the only comparison is the group's own prior month.
The problem sits inside the payment detail. A major payer has started allowing fewer time units on a recurring class of cases. The payer's remittance language varies slightly, so the reductions are posted across several adjustment categories rather than displayed as one obvious policy change. At the same time, accounts tied to those cases remain open longer, but the increase in A/R days is gradual enough to disappear inside an overall average.
Without a payer-specific peer benchmark, the group can't tell whether the reduction reflects its own documentation, a coding issue, a contract variance, or a broad payer behavior pattern. Without a same-payer internal trend, leaders can't isolate the date when the change began. The result is false stability, not operational control.
Practical rule: A benchmark should help someone decide what to investigate next. If it only ranks departments, it's a scoreboard.
The distinction matters because revenue leakage rarely appears as one dramatic event. It can emerge through missed units, incorrect modifiers, avoidable denials, unclassified contractual adjustments, or payments that fall below an expected allowed amount. A useful explanation of how those losses accumulate appears in this guide to revenue leakage in healthcare.
For anesthesia, IONM, and ASC operators, internal dashboards often hide the signal by combining unlike claims. A blended collection rate may include different payers, procedures, modifiers, and contract terms. A total denial rate may combine a preventable eligibility denial with a payer downcode that requires escalation. The average looks calm because the data has been flattened.
Performance benchmarking restores the missing context. It compares like with like, exposes outliers, and gives the RCM director a defensible answer to three operational questions:
- What changed? Identify the payer, code family, facility, or workflow where performance moved.
- Is the change internal or external? Compare the affected cohort with both the group's own baseline and a properly matched peer set.
- Can the finding support recovery? Preserve the normalized claim, remittance, contract, and chronology so the analysis can become evidence.
Defining the KPIs That Actually Move Reimbursement
Start with cash-moving KPIs, not the measures that are easiest to export. A metric belongs in the operating model only when it connects to a decision, an accountable owner, and a defined response.
The most useful core set usually includes net collection rate, days in A/R, clean claim rate, first-pass denial rate, and underpayment recovery rate. Each answers a different question. Net collection rate tests whether collectible revenue becomes cash. Days in A/R shows how long that cash remains exposed. Clean claim and first-pass denial measures identify front-end and submission defects. Underpayment recovery rate tests whether the team is finding and converting payer variance into payment.
Specialty work requires more precision. An anesthesia group should track time-unit capture accuracy, including documented, coded, billed, and paid units. An IONM operation needs visibility into professional and technical billing splits, modifier behavior, and case-level payment variance. An ASC should separate facility reimbursement, professional claims, device pass-through treatment, and payer-specific denial reasons rather than treating the encounter as one financial event.
A practical KPI filter is simple:
- Name the owner. Coding, billing, denial management, contract administration, or payer relations should have clear responsibility.
- Define the action. A variance should trigger a workqueue, audit, appeal, education cycle, or contract review.
- Set the threshold. Use a target band, not an unexplained number. Document why the band exists and who can change it.
- Make the metric reproducible. Another analyst should be able to recreate it from the same source records.
- Retire passive measures. Gross charges and total encounters may provide context, but they shouldn't dominate the leadership view if they don't change reimbursement decisions.
The RCM metrics guide provides a useful reference point for organizing benchmarked measures around collection, claim quality, A/R, and denials. The operating principle remains more important than the dashboard vendor: every metric must lead to a named action.
| KPI | Action-Driving or Vanity | Owner | Typical Threshold | Review Cadence |
|---|---|---|---|---|
| Net collection rate | Action-driving | RCM director or contract lead | Defined against a normalized baseline | Weekly and monthly |
| Days in A/R | Action-driving | A/R manager | Target band by specialty and payer cohort | Weekly |
| Clean claim rate | Action-driving | Billing operations lead | Escalation band for preventable defects | Daily and weekly |
| First-pass denial rate | Action-driving | Denial manager | Root-cause review when variance persists | Weekly |
| Underpayment recovery rate | Action-driving | Contract or payer relations lead | Recovery target by payer cohort | Weekly and monthly |
| Gross charges | Usually vanity | Finance | Context only | Monthly |
| Total encounters | Usually vanity | Practice operations | Volume context only | Monthly |
The word typical in a threshold column should never mean universal. A target copied from another organization can be misleading if payer mix, case mix, staffing, or contract structure differs. Use the threshold as a documented operating decision, then test whether it predicts actual cash and workload.
Sources, Normalization, and Apples-to-Apples Comparisons
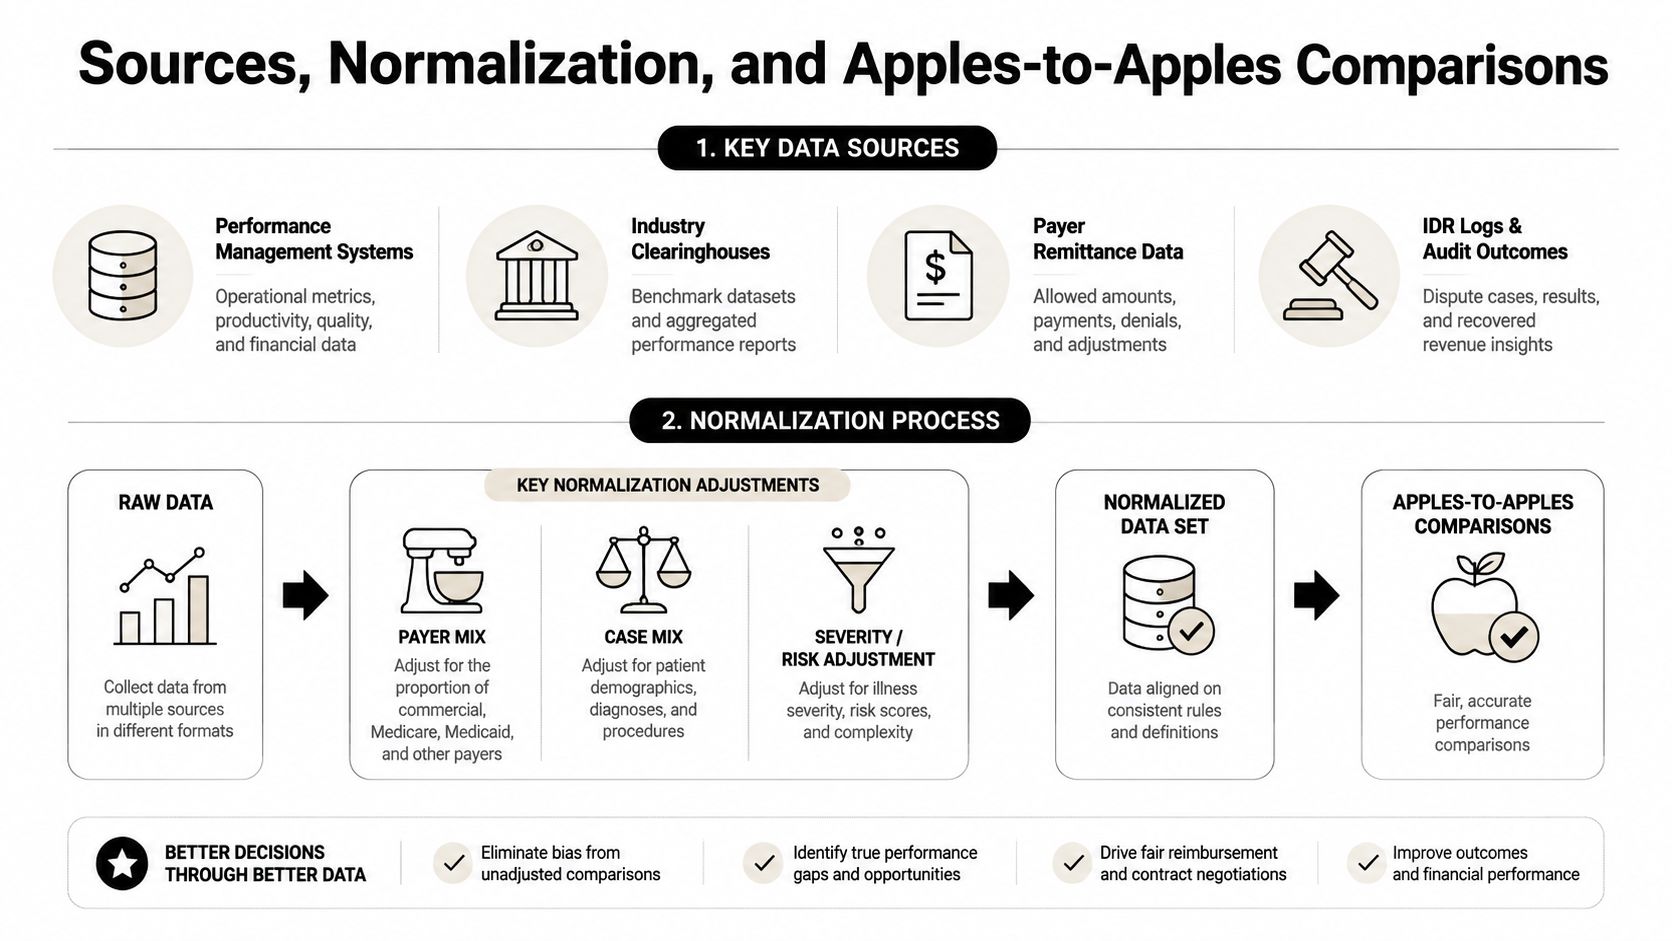
Benchmark credibility starts before the dashboard. Pulling a number from a practice-management system and comparing it with a number from another group doesn't create a benchmark. It creates a comparison that may be distorted by different definitions, posting rules, payer contracts, and case composition.
A dependable RCM dataset usually joins several sources:
- PM system records for claims, charges, payments, adjustments, balances, dates, and work status.
- Clearinghouse data for acceptance, rejection, transmission, and claim-status events.
- Payer remittances for allowed amounts, reductions, denial codes, remark codes, and payment timing.
- Contract and fee schedule files for expected reimbursement and carve-outs.
- IDR logs for disputed claims, payer responses, evidence status, and recovery outcomes.
Normalize the data before calculating a peer comparison. A group with a high share of complex anesthesia cases shouldn't be compared with a group whose volume is dominated by shorter, lower-intensity services. The same applies to IONM case types and ASC procedure groupings. Weight results by comparable CPT families, ASA class where relevant, procedure grouping, payer, modifier profile, and facility context.
The normalization checklist
Fee schedule parity comes first. Confirm that both groups use the same contractual basis, effective dates, carve-outs, and expected allowed amount logic. A raw net collection rate can look worse because one organization records contractual adjustments at charge posting while another records them after adjudication.
Payer mix needs its own cut. Separate commercial, government, self-pay, and other payer categories where the underlying reimbursement rules differ. Then go further. Compare the same payer and product when the question involves underpayment or policy behavior.
Case mix prevents false conclusions. Group anesthesia claims by comparable service families and time-unit patterns. Separate IONM professional and technical components. For ASCs, distinguish procedure categories and device-related reimbursement rather than averaging all facility claims together.
Write-off classification must be explicit. Bad debt, contractual adjustment, timely filing loss, coding-related write-off, and unresolved underpayment aren't interchangeable. If the organization posts them into one bucket, the benchmark can't tell a preventable operational loss from a contractual result.
The performance-testing literature makes the same methodological point in a different setting. A reliable workflow should separate cold, warm, and hot runs, document the full reproducibility bundle, validate correctness before comparison, repeat runs, and report stable measures such as the median, confidence intervals, and standard deviation. Those principles from performance testing guidance translate directly to RCM analytics: define the population, preserve the inputs, document the calculation, and confirm that the measure is correct before interpreting the result.
Peer Benchmarks Versus Internal Trend Benchmarks
Peer and internal benchmarks answer different questions, so choosing between them is usually a mistake.
Peer benchmarks provide context. A comparable anesthesia cohort can show whether a group's denial rate, A/R profile, or net collection rate is materially different from organizations with similar specialty, payer mix, and charge profile. Peer data is especially useful during payer negotiations, staffing discussions, budget planning, and underpayment sizing.
Internal trend benchmarks provide accountability. A same-payer, same-coder, same-facility comparison can reveal a workflow drift that broad peer data will miss. It can show when a new edit created rejections, when training failed to change time-unit capture, or when a contract variation began affecting payment. Internal trends are also the cleanest way to test whether a corrective action worked.
Consider an anesthesia group whose denials rise by 4% against its internal baseline while comparable peer performance remains flat. That pattern points away from a general market movement and toward a localized cause, such as a single payer policy change, a clearinghouse edit, a coder transition, or a documentation issue. The exact cause still requires claim-level review, but the benchmark has narrowed the search.
| Decision Moment | Peer Benchmark | Internal Trend Benchmark |
|---|---|---|
| Payer negotiation | Sizes the gap against comparable groups | Shows the group's payer-specific history |
| Staffing request | Demonstrates whether workload and results are out of line | Shows queue growth and productivity drift |
| Underpayment review | Establishes whether payment behavior is unusual | Identifies the start date and affected cohort |
| Denial investigation | Provides external context | Locates the payer, coder, facility, or workflow |
| Corrective-action follow-up | Confirms whether results are competitive | Proves whether the intervention changed performance |
| IDR preparation | Supports a normalized baseline | Supplies chronology and claim-level documentation |
The best programs layer both. Use the peer view to avoid mistaking an industry-wide condition for an internal failure. Use the internal view to assign work and prove that the organization responded.
Peer data also needs skepticism. A benchmark source that combines unlike specialties or fails to disclose metric definitions can create false confidence. Ask how the cohort was built, what the denominator includes, how adjustments are classified, and whether the comparison reflects the same reimbursement environment.
Dashboards, Cadence, and Governance That Drive Action
A dashboard should change what someone does this week. A PDF that arrives after month-end and contains no owner, threshold, or next action is a report, not an operating system.
Build the reporting model in three layers.
Daily operations
The daily board belongs to workqueue managers. It should surface new denials, high-value underpayments, claims awaiting corrected submission, pending payer responses, and IDR deadlines. Keep the view narrow enough that a manager can assign work during a huddle.
Each alert needs one action. A red underpayment item might require contract validation. A denial alert might require coding review. A pending IDR response should have a responsible person and an archive location for the final evidence.
Weekly RCM review
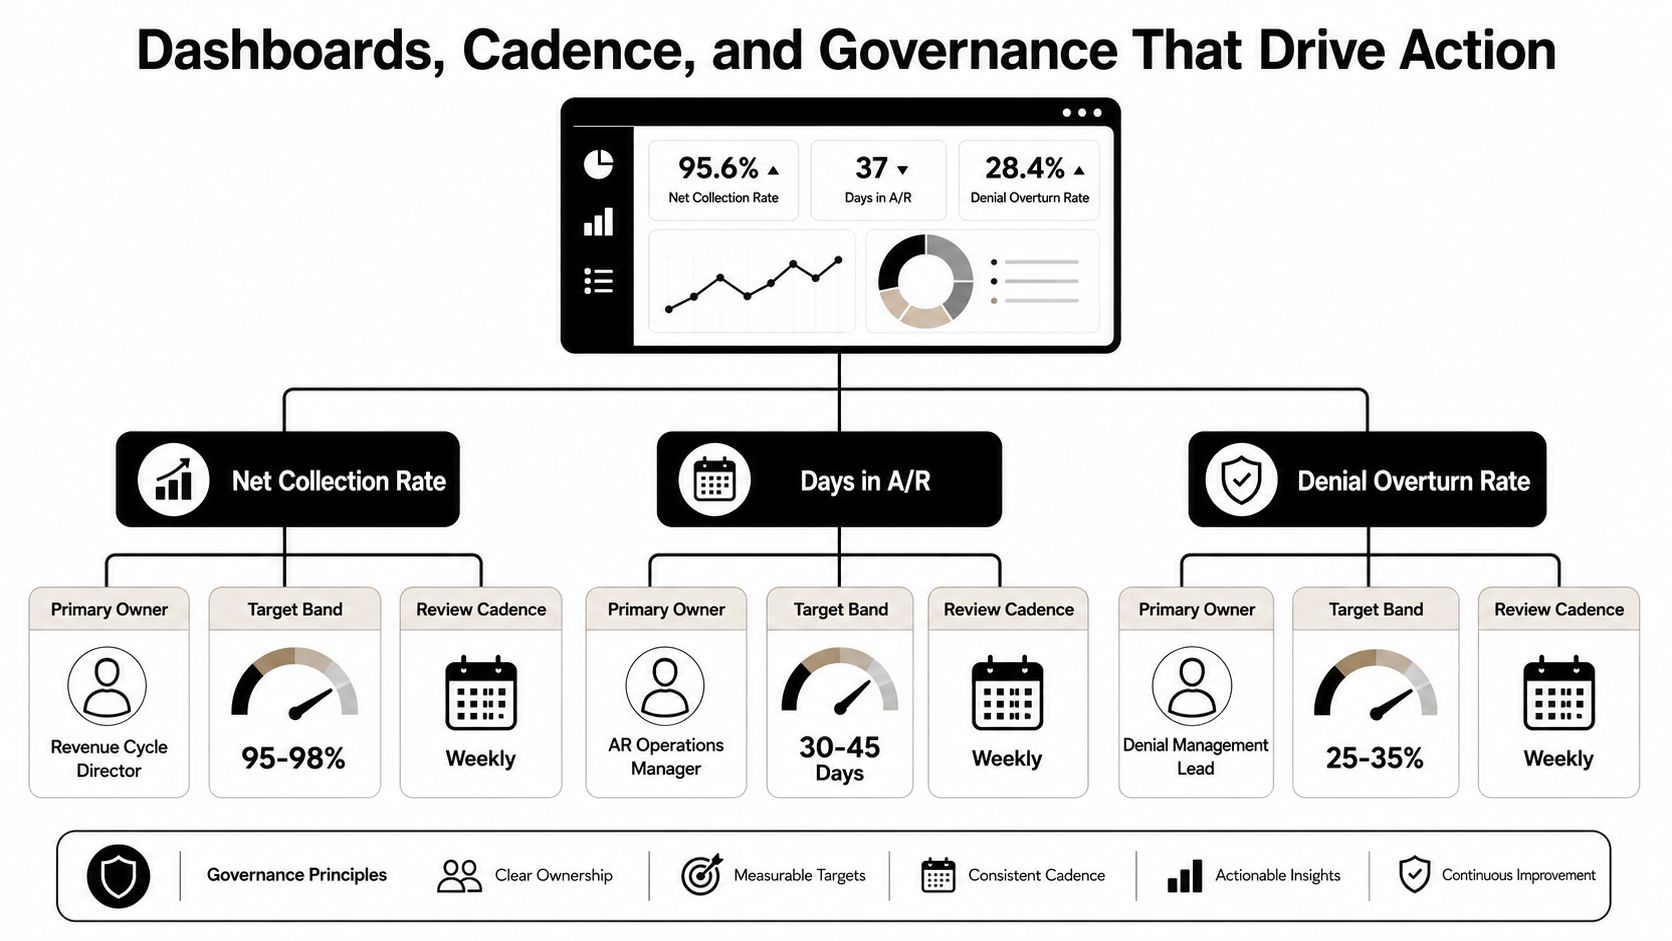
The weekly review belongs to the RCM lead and specialty owners. Slice days in A/R, net collection rate, clean claim rate, denial overturn rate, and underpayment recovery by payer, facility, provider, and service line where the data supports it.
An ASC group, for example, can use the weekly view to spot a 6% drop in IONM reimbursement before the change reaches the quarterly close. The point isn't to celebrate the dashboard's detection. The point is to identify whether the drop comes from a technical-professional split, a payer edit, missing documentation, a modifier pattern, or an expected contract change.
Monthly executive view
Executives need a concise comparison against the approved peer and internal baselines. Show the variance, financial exposure qualitatively or through validated organization-specific amounts, the accountable leader, and the decision required. Don't bury a payer issue inside a blended specialty average.
Governance keeps targets from becoming arbitrary.
- Target changes: Require documented approval from the RCM owner and finance or contract leadership.
- Exceptions: Log the reason, affected cohort, start date, and expected resolution.
- Escalation: Define which persistent or high-risk variances reach the CFO, compliance lead, or payer-relations executive.
- IDR archive: Preserve the source claims, remittances, contract references, calculations, correspondence, and final outcome under a stable case identifier.
A target without a governance rule becomes an opinion. A target with an owner, threshold, and evidence trail becomes a control.
Dashboard color coding should remain simple. Red means a named escalation, yellow means assigned investigation, and green means the metric sits inside its approved band. Don't use color to create urgency without defining the response.
Connecting Benchmark Outputs to IDR and Specialty Workflows
The most valuable benchmark is one that can become part of an evidence packet. Payers may challenge whether a billed charge reflects the actual service, the documented workload, or the applicable reimbursement context. Clean, normalized RCM data gives the dispute a traceable foundation instead of relying on an isolated rate quote.
A benchmarked KPI library can map directly to IDR exhibits:
- Denial reason frequency shows which payer behaviors affect the disputed service line.
- Underpayment variance by CPT connects the expected amount, billed amount, allowed amount, and paid amount.
- Payer-specific allowed-to-billed ratios provide context for the reimbursement pattern when the denominator and contract logic are documented.
- Payment timing establishes the chronology of initial adjudication, correction, appeal, and final payer response.
The specialty detail matters. For anesthesia, compare documented time units with coded, billed, allowed, and paid units. For IONM, separate professional and technical components and preserve the applicable modifiers. For ASCs, isolate device pass-through denials from facility payment issues so the arbitrator can see the actual dispute rather than a blended encounter result.
The Independent Dispute Resolution resource belongs in an operating workflow, not in a separate legal drawer. Tie each dashboard KPI to an IDR template containing the benchmarked baseline, the affected claim population, the workload required to deliver the service, the payer chronology, and the source documents supporting each calculation.
One discipline prevents most evidence problems: reproduce the dashboard number inside the dispute file. If the analyst can't recreate the KPI from archived claims, remittances, definitions, and calculation logic, the measure shouldn't drive an IDR position.
Benchmarking guidance warns against treating correlated trials as independent and reporting a raw success percentage without modeling task relationships. In RCM, the equivalent mistake is treating every claim as an independent proof point when a payer policy affects an entire cohort. A payer-specific cluster, service family, or effective-date period may be the true unit of analysis. Model that relationship instead of overstating the apparent volume of independent evidence.
A 90-Day Plan to Make Performance Benchmarking Stick
A group can report a strong collection rate and still miss the operational weaknesses that determine whether underpayments are recoverable. Without stable definitions, controlled source data, assigned ownership, and an evidence trail, one payer policy change can expose the gap. Benchmarking maturity is therefore a better indicator of revenue integrity than any isolated KPI.
A phased rollout gives each specialty and payer a workable operating model instead of forcing anesthesia, IONM, and ASC data into one comparison.
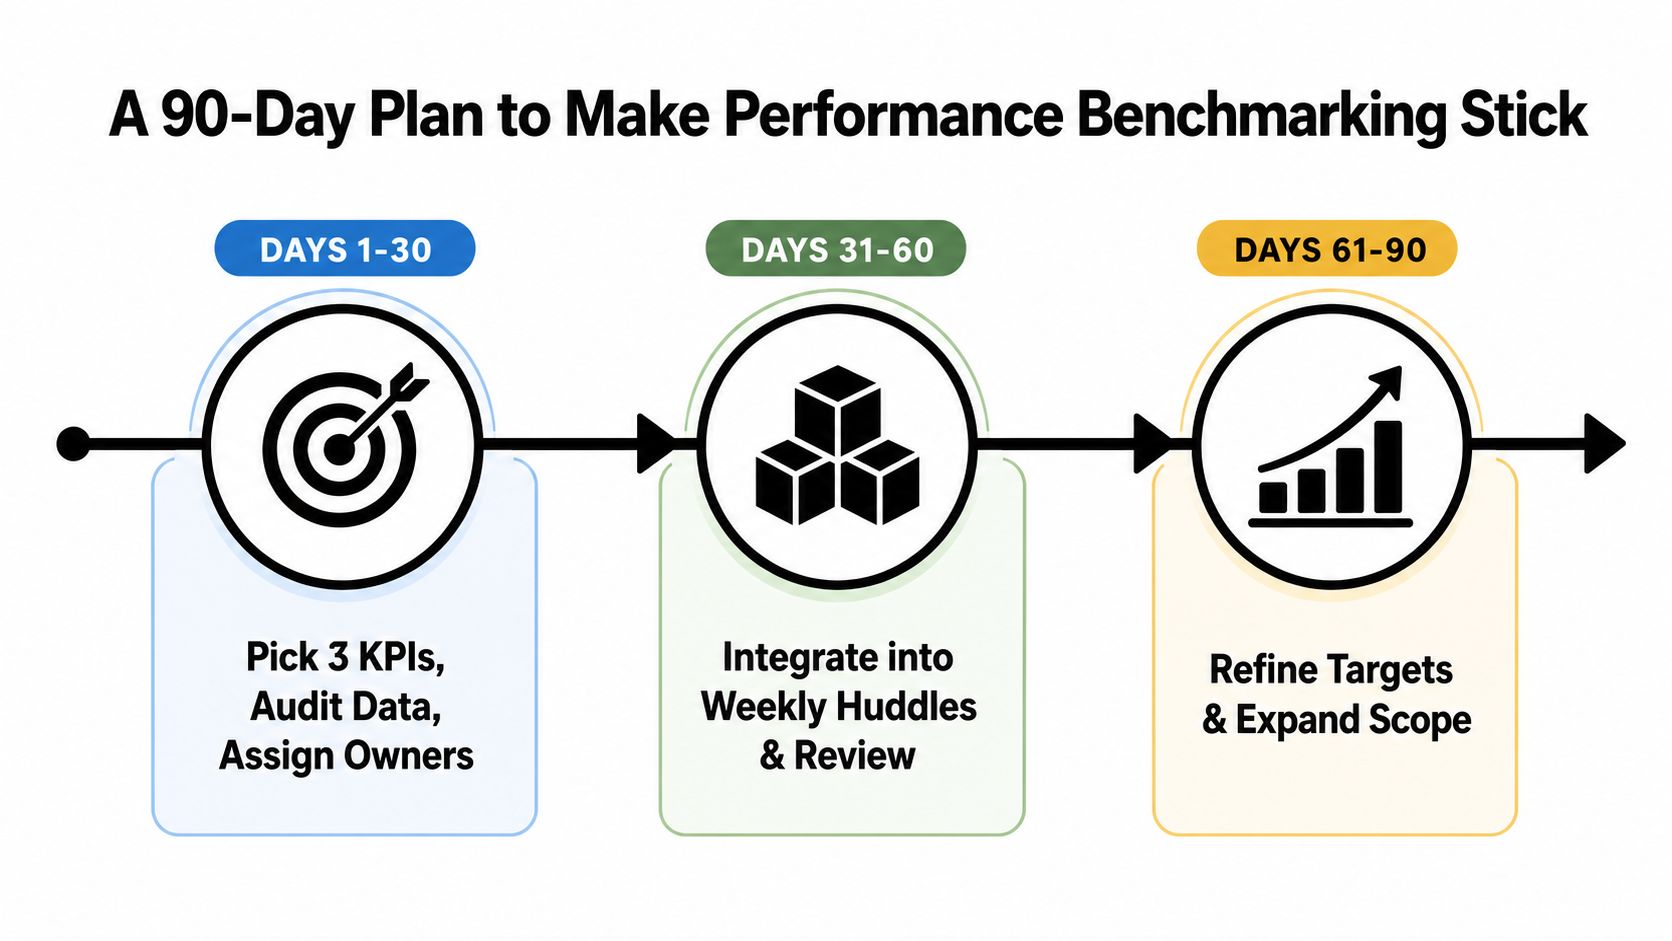
Days 1 through 30
Select three cash-moving KPIs. Net collection rate, days in A/R, and denial overturn rate are practical starting points, but the final set should match the group's most urgent leakage pattern. Audit the source systems, document each denominator, and assign a benchmark owner for every specialty line in scope.
Publish a concise KPI dictionary. Define inclusion and exclusion rules, posting dates, adjustment categories, payer groupings, and the approved refresh schedule. If two analysts can produce different results from the same claims, remittances, and adjustments, the measure is not ready for management use.
Days 31 through 60
Build the dashboard and lock normalization rules before publishing comparisons. Pull one defensible peer cohort, then test the method against an open underpayment. That first IDR evidence file tests the entire data model. It should reveal missing remittances, inconsistent contract versions, unsupported adjustments, and gaps in claim chronology.
A benchmark becomes useful when its calculation can be reproduced inside the dispute file. Preserve the source claims, remittances, definitions, adjustment logic, and effective dates that support the result. Clean, normalized RCM data gives the arbitration record a measurable baseline, identifies the affected claim population, and connects the payment variance to the work performed.
Days 61 through 90
Run the weekly review, set variance thresholds, and require root-cause notes for every breach. Connect recurring gaps to coaching, coding audits, payer escalation, and contract renegotiation playbooks. Expand the dashboard only after the initial measures produce decisions that finance, coding, RCM, and payer-relations leaders can defend.
Initial deliverables should include a governance charter, published KPI dictionary, assigned owners, normalization rules, peer cohort definition, and a quarterly review involving finance, coding, RCM, and payer-relations leaders. An internal data stack or specialized analytics platform can support the process. RevGuard also connects specialty-specific RCM workflows with IDR preparation and enforcement.
Operating standard: If the number can't be explained, reproduced, assigned, and used in an evidence file, it isn't mature enough to guide revenue decisions.
Benchmarking has a long history as a management discipline. Its formal use is widely traced to Xerox, which coined the term in 1979 after facing pressure from Japanese copier rivals. Structured comparison had become mainstream by the late 2000s. The history of benchmarking shows why the practice endured. Comparison creates value when leaders use it to change operations, not when they collect scores.
The software market reflects demand for measurable comparison. Market reporting places global benchmarking software at about USD 4.79 billion in 2025, rising from roughly USD 4.43 billion in 2024 and projected to reach about USD 10.5 billion by 2035 at an 8.1% CAGR, though estimates vary by market definition and scope. The benchmarking software market report points to a practical lesson for RCM leaders: systems can make performance visible, but definitions and evidence quality determine whether that visibility supports recovery.