

You're probably looking at a spreadsheet right now that tells you something is wrong, but not what to do next. Aging A/R is creeping up. Denials are eating staff time. One payer keeps paying late or light. Your billing team is busy all day, yet cash still feels unpredictable.
That's where most discussions about revenue cycle management metrics stop. They define the numbers, maybe offer a benchmark, then leave practice managers to figure out how those numbers connect to actual operational decisions.
In specialty care, that gap is expensive. Metrics aren't just scorekeeping. They tell you where claims become vulnerable, where payer behavior shifts, and whether your organization is building claims that can hold up when payment gets challenged. If you handle complex billing, out-of-network exposure, high-acuity services, implants, drugs, or procedure-heavy encounters, you don't need more reports. You need a way to turn raw data into faster payment, fewer preventable denials, and stronger footing when disputes escalate.
Beyond the Numbers A New Way to View RCM
Many organizations treat revenue cycle management metrics as lagging indicators. They review last month's dashboard, identify what missed target, and ask staff to work harder. That approach creates motion, not control.
A better way to use metrics is to treat them as an early warning system and a legal-defense file at the same time. A denial trend rarely starts in the denial queue. It usually starts upstream, with registration, eligibility, authorization, coding logic, modifier use, documentation quality, or payer-specific edits that no one caught soon enough.
What practice leaders often miss
A metric only matters if it answers one of three questions:
- Where is cash slowing down
- Where is revenue leaking out
- Which claims are becoming harder to defend
If a report doesn't help you answer one of those, it's noise.
That's why isolated KPI tracking fails. A rising A/R balance without payer segmentation tells you very little. A denial report without root-cause grouping doesn't tell your front desk, coding team, or follow-up staff what to fix. And a strong collection month can hide a structural problem if staff recovered cash through manual appeals that shouldn't have been necessary in the first place.
Practical rule: Track metrics in a way that identifies the operational handoff where the claim became fragile.
Metrics as a forward tool
The strongest revenue teams use metrics to shape behavior before adjudication. They ask different questions:
- Front end: Are we verifying the right details for the types of claims that usually get challenged?
- Mid-cycle: Are coding and charge capture producing claims that are payer-ready, not just billable?
- Back end: Are underpayments and denials random, or do they follow a payer pattern worth escalating?
That last point matters more now than many groups realize. A practice that tracks clean claim quality, denial patterns, payer turnaround, and underpayment trends with discipline isn't just improving operations. It's building the factual record needed to push back when reimbursement doesn't match what was owed.
The Four Pillars of Revenue Cycle Health
A specialty practice can post a decent month and still be building weak claims.
I see this when a group focuses on cash collections alone. Payments are coming in, staff is busy, and aging does not look alarming at first glance. Then a payer starts denying a narrow set of higher-value claims, or underpaying out-of-network encounters that should have been defended more aggressively. The problem usually started earlier, inside four metrics that show whether claims were built to survive scrutiny.
Days in A/R
Days in A/R measures how long receivables stay outstanding before they turn into cash. Used well, it is less a finance metric than an operational map. A rising number can point to delayed charge entry, weak claim follow-up, payer slowdown, or a front-end defect that did not become visible until adjudication stalled.
The calculation method matters because different formulas can hide or exaggerate the problem. As noted earlier, HFMA recommends a disciplined approach that uses current receivables net of credits and average daily charges, along with close control of older A/R.
For dispute readiness, segment this metric before acting on it. Review Days in A/R by payer, service line, and claim type. If one payer's A/R is stretching while clean claim performance remains stable, the issue may be payment behavior rather than internal execution. That distinction matters when you later need to show a pattern of delayed or reduced reimbursement.
Clean Claim Rate
Clean Claim Rate shows how often claims leave your system ready for payer acceptance without preventable defects. It is one of the clearest indicators of whether patient access, coding, and charge capture are working together.
A high clean claim rate does not guarantee full payment. It does give the practice a stronger starting position. Claims that go out with correct demographics, authorization details, modifiers, and documentation hooks are easier to adjudicate and easier to defend if the payer underpays or questions medical necessity.
This is especially important in procedure-heavy specialties. A radiology group, for example, can look operationally stable while losing ground on modifier errors, order documentation gaps, or exam-specific authorization issues that later weaken appeals. Teams managing that complexity usually need specialty-specific controls, not generic dashboards. That is why many practices build their review process around radiology revenue cycle workflows and denial patterns.
Denial Rate
Denial rate becomes useful only when it is tied to ownership.
A single denial percentage does not tell a manager what to fix. Denials should be grouped by payer, denial category, location, provider, and service type. Then the practice can assign the first correction to the right team. Eligibility denials belong to front desk leadership. Coding denials belong to coding. Medical necessity denials often require a combined response from clinicians, coders, and payer follow-up staff.
This metric also has direct value in IDR and broader payment disputes. If a payer repeatedly denies or downgrades the same class of claims, denial trend data helps establish that the issue is systemic, not isolated. That is a stronger position than arguing from one claim at a time.
Net Collection Rate
Net Collection Rate answers a harder question than total cash posted. It shows how much of the allowed or expected reimbursement the practice collected after contractual adjustments.
Even strong-looking operations can still lose margin. A practice may submit claims quickly, work denials consistently, and post payments on time while still missing revenue through silent underpayments, weak secondary billing, avoidable write-offs, or unresolved patient balances. In specialty settings, I pay close attention to this metric when the denial rate appears manageable but reimbursement still lands below expectation. That pattern often points to underpayment detection problems, not just collections performance.
For dispute preparation, Net Collection Rate helps identify whether the actual loss is denial volume or payment variance. If the claim is getting through but the payer is paying short, the practice needs contract comparison, expected allowed logic, and case-level support files. Those are the same records that strengthen escalation and formal payment challenges.
Key RCM metric benchmarks
| Metric | Formula | Good Benchmark | Excellent Benchmark |
|---|---|---|---|
| Days in A/R | Current receivables, net of credits, divided by average daily charge amount | Healthy performance depends on specialty, payer mix, and aging discipline | Stable performance with tightly controlled old A/R |
| A/R over 90 days | Receivables aged over 90 days divided by total receivables | Lower is better when matched with clean posting and follow-up discipline | Sustained low old A/R without aggressive write-offs |
| Clean Claim Rate | Claims received by payer divided by claims dropped | High and consistent | High and consistent across payers and service lines |
| First Pass Rate | Paid or resolved on initial submission divided by total submitted claims | Strong enough to limit avoidable rework | Consistently strong without manual rescue work |
| Net Collection Rate | Payments collected divided by expected reimbursement after write-offs | Strong recovery of collectible revenue | Strong recovery with underpayments actively identified |
| Claim Denial Rate | Denied claims divided by total claims | Controlled and trending down by root cause | Low, segmented, and tied to accountable owners |
These four pillars work together. Rising A/R plus a drop in clean claim performance usually points to upstream execution failures. Stable clean claims with weaker net collection often points to underpayments or payer behavior. Denial trends tied to one service line can show where documentation is making claims harder to defend.
That is the shift mature revenue teams make. They stop treating metrics as a scorecard and start using them to produce claims that can hold up in an appeal, a payer escalation, or an IDR filing.
How Metrics Differ Across Specialties and Settings
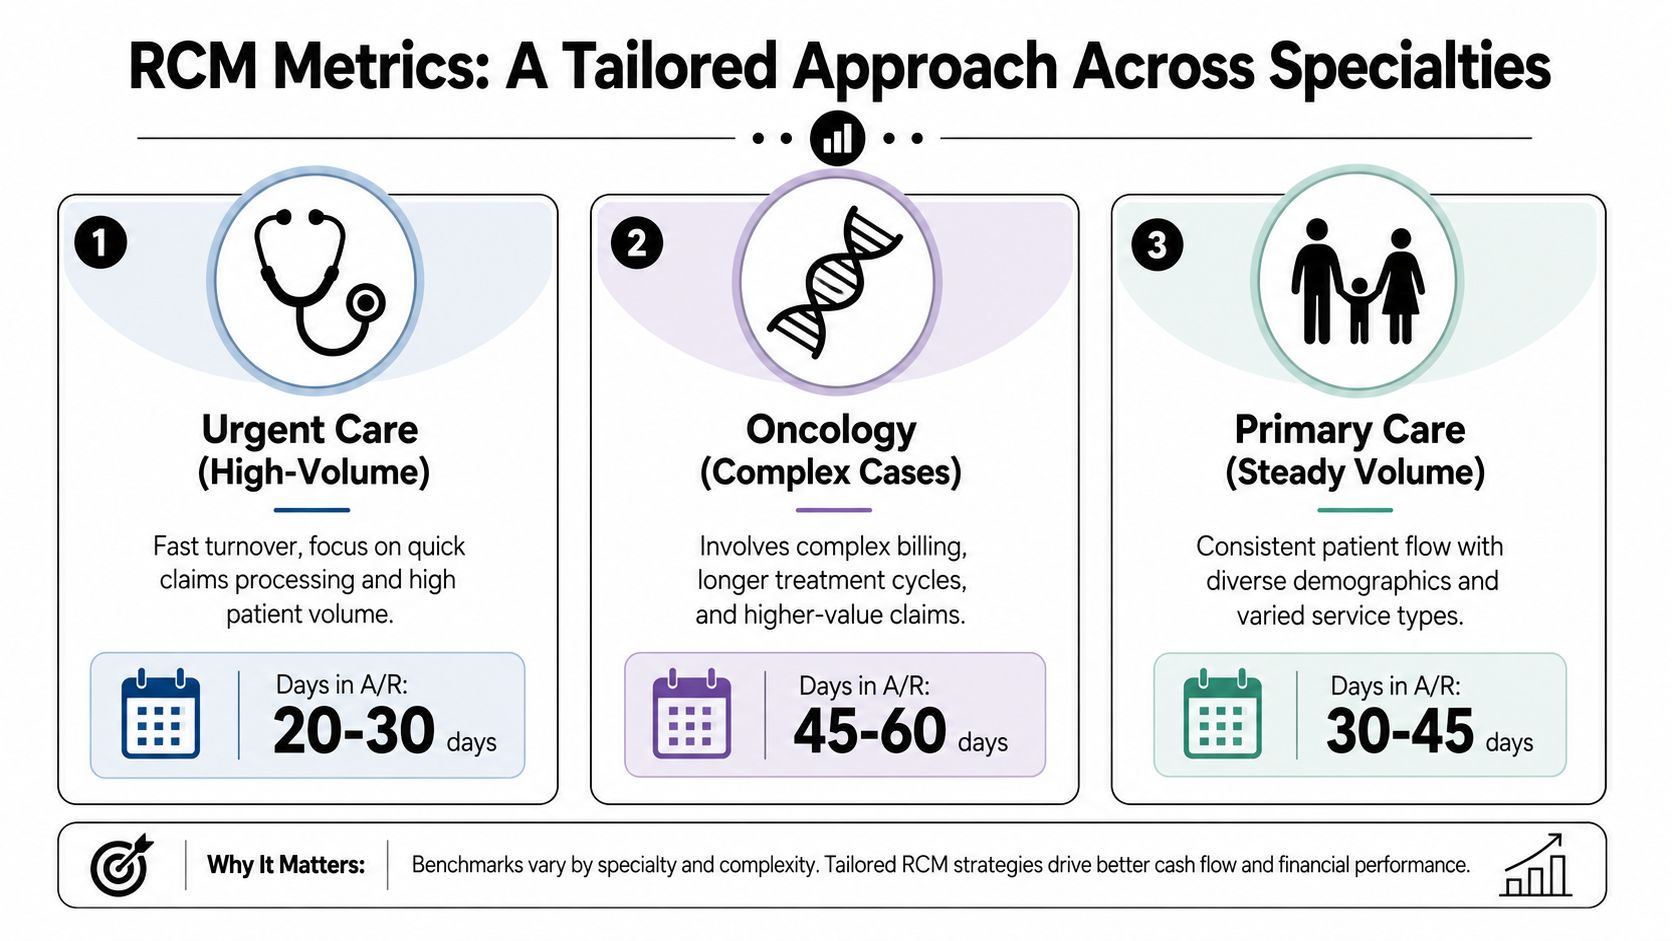
A benchmark is a reference point, not a substitute for context. The same revenue cycle management metrics can mean very different things depending on specialty, setting, and payer mix.
A high-volume urgent care operation is built for throughput. It depends on standardized visits, fast registration, and quick claim submission. An oncology group deals with longer treatment arcs, more documentation complexity, more authorization touchpoints, and larger claims that may invite closer payer scrutiny. Primary care sits somewhere in the middle, with steadier volume and broader variation across services.
Why specialty context changes the interpretation
Specialty practices often make the mistake of copying generic dashboard targets without adjusting for claim complexity.
- Procedure-heavy specialties: Orthopedics, gastroenterology, and interventional fields usually face more coding detail, modifier sensitivity, implant or supply issues, and medical necessity scrutiny.
- Hospital-based groups: Anesthesia and emergency-aligned services often deal with fragmented data handoffs, registration quality that they don't fully control, and payer disputes tied to out-of-network dynamics.
- Imaging and diagnostic services: Radiology groups need tight charge capture, documentation support, and payer-rule discipline. A broad example appears in RevGuard's discussion of radiology practice revenue cycle needs, where workflow precision matters as much as billing speed.
- Air ambulance and similar high-acuity services: These providers may submit fewer claims than a clinic-based specialty, but each claim carries heavier reimbursement risk, more documentation burden, and more frequent payment conflict.
What good operators do differently
They don't ask, “Are we at benchmark?” first. They ask, “Which metric matters most for the way this specialty gets paid?”
In complex specialties, one weak handoff can outweigh otherwise solid dashboard performance.
For dermatology, front-end speed and clean claims may dominate. For anesthesia, payer segmentation and denial root cause may matter more. For oncology, the quality of authorization, documentation consistency, and underpayment detection may carry more weight than a single headline metric.
That's why specialty-specific governance beats generic KPI reporting. The same number can signal normal complexity in one setting and preventable breakdown in another.
From Raw Data to Actionable Dashboards
Most dashboards fail because they try to impress instead of guide action. They include too many tiles, too many colors, and not enough explanation of who should do what when a metric moves.
A useful dashboard is built around decisions. It should help a manager identify whether the problem sits in intake, coding, payer adjudication, follow-up, or patient collections.

What belongs on the first page
Keep the top layer narrow. For most specialty groups, the first page should show:
- Cash velocity metrics: Days in A/R and aging movement
- Claims quality metrics: Clean claims and first-pass performance
- Leakage metrics: Denials, underpayments, and net collection trend
- Payer behavior views: Turnaround changes and denial concentration by payer
If your team uses spreadsheets, this can still work. A good workbook with disciplined definitions is better than a complex BI tool nobody trusts. If you use a dedicated analytics platform, the priority is still the same. Show trend lines, segment by payer and specialty, and assign ownership to each exception. Teams evaluating more mature reporting setups often look for tools that support drill-down and exception tracking, such as healthcare-focused business analytics workflows.
Trends matter more than snapshots
Daily fluctuations create noise. Trend lines create management value.
Review metrics over consistent intervals and compare them across dimensions that matter operationally:
| Dashboard view | What it reveals |
|---|---|
| By payer | Whether one insurer is driving slow payment, denials, or underpayments |
| By location | Whether a site-specific registration or workflow issue exists |
| By specialty or provider | Whether documentation, coding, or charge capture varies too much |
| By denial category | Which upstream handoff is creating rework |
A dashboard should also separate lagging and leading indicators. Net collection tells you what happened. Clean claims and denial category trends often tell you what's about to happen.
Build for investigation, not presentation
Strong dashboards let a manager move from red metric to work queue in a few clicks or a few filters. Weak dashboards stop at “performance is down.”
Use plain labels. Define every metric the same way every month. If one team calculates clean claims differently from another, your dashboard becomes an argument instead of a management tool.
The best dashboard isn't the one with the most data. It's the one that helps a supervisor assign the next corrective action before the week ends.
A Triage Plan for Your Revenue Cycle
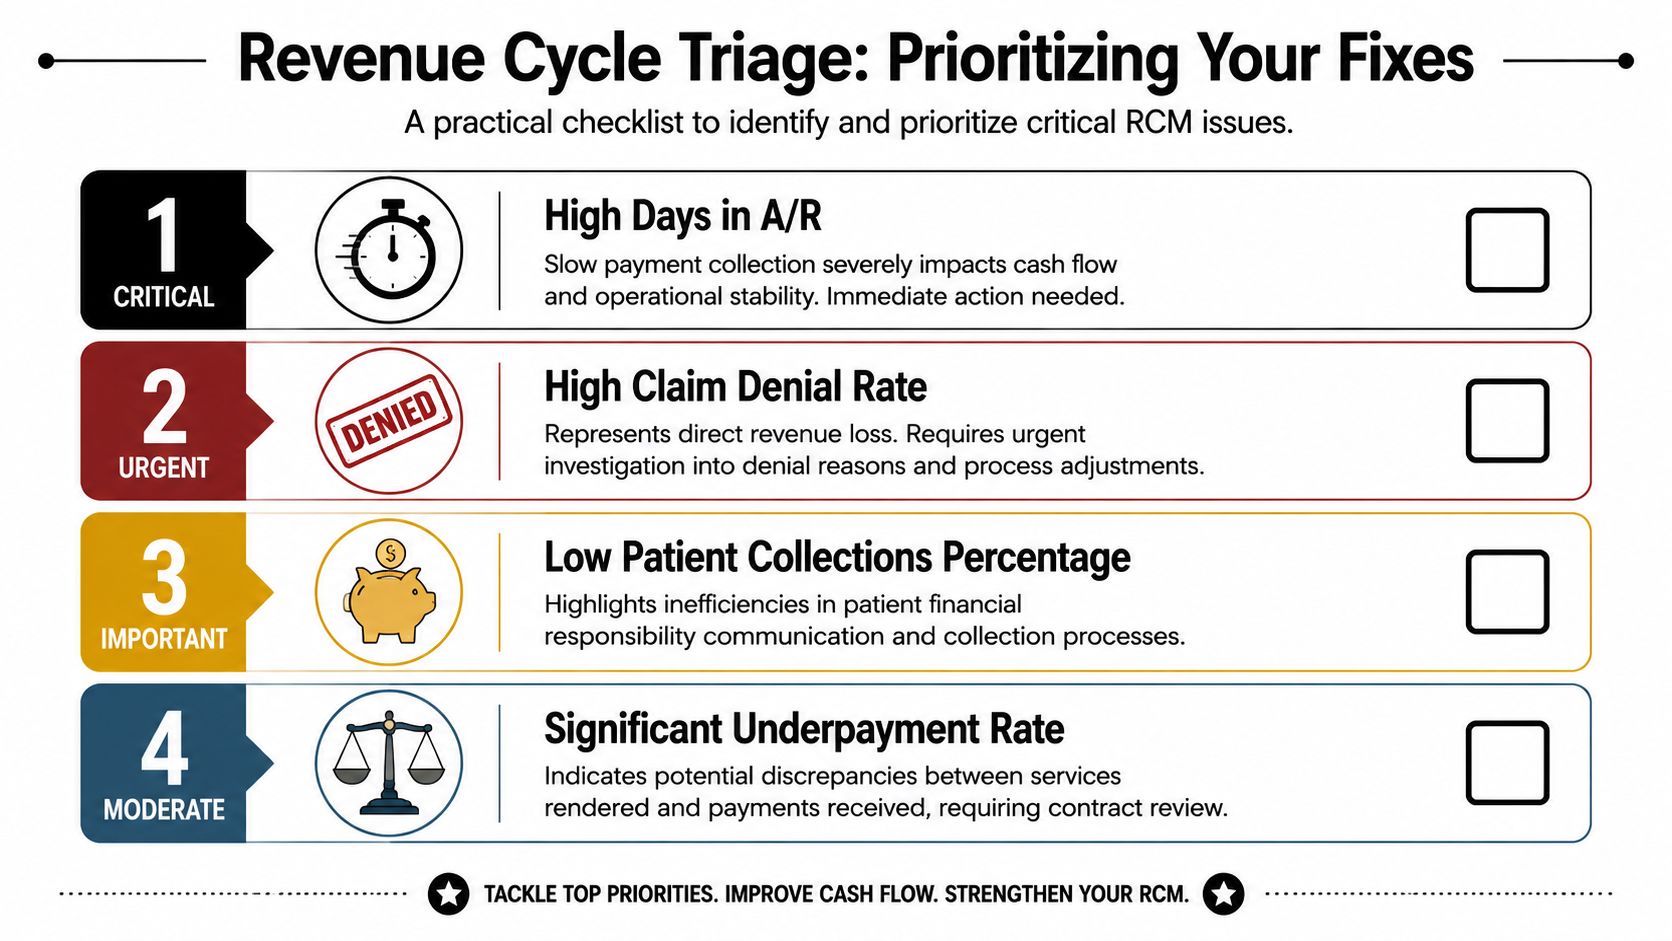
Monday starts with three alarms at once. Cash posted is down, aging is climbing, and your denial team says it is already overloaded. The wrong response is to launch five projects and hope one works. A better response is triage. Stabilize the part of the revenue cycle that puts cash at risk now, then fix the upstream defect that will keep the same claim from failing again.
Fix order matters
Start with aging and cash conversion. If Days in A/R is rising or old A/R is piling up, the practice already has a throughput problem, a payer performance problem, or both. Separate the inventory before assigning blame. Break A/R into payer, age bucket, location, and financial class so you can see whether the issue is concentrated or systemwide.
Then check whether the balances are still collectible.
- If Days in A/R is high, review recent claims by payer and submission date. Broad slippage usually points to intake, coding, charge lag, or claim edit failure. Concentrated slippage usually points to payer adjudication, contract variance, or weak follow-up.
- If A/R over 90 days is growing, look for timely filing risk, unworked appeals, and accounts sitting in a status that looks open but has no active owner.
- If staff activity is high but cash is flat, compare payment posting volume with unresolved denials, underpayments, and credits. Effort does not equal yield.
This is also the point to tighten your denial management workflow for healthcare claims. A good triage process does not stop at counting denials. It identifies which denial categories are still creating future A/R.
Match each weak metric to the first likely failure point
The first move should be specific.
- Clean claim weakness: Check registration accuracy, eligibility verification, authorization capture, and edits that are being overridden too often.
- Denial growth: Group denials into a few cause families and find the largest source of preventable volume first.
- Weak net collection: Review underpayment detection, adjustment patterns, secondary billing, and patient balance follow-up.
- Self-pay drag: Examine financial clearance, estimate accuracy, statement timing, and payment plan setup.
For specialty groups, I also advise one extra question: which of these failures would make an underpayment or IDR case harder to prove later? A missing authorization note, inconsistent modifier use, or poorly documented medical necessity issue is not just an operational defect. It can weaken your position when you need to challenge payment.
Avoid the common triage mistakes
One common mistake is sending more work downstream when the defect started upstream. If registration is wrong, the appeals team inherits bad inventory. If documentation is thin, coding and dispute teams are forced to defend a claim that was weak from day one.
Another mistake is treating payer behavior and internal quality problems as the same issue. They are not. An authorization denial tied to one front-end workflow needs a different fix than a payer that is systematically reducing payment on a specific CPT range.
The third mistake is measuring improvement at the wrong level. After an authorization retraining, the earliest sign of progress may be one denial code dropping for one payer at one site. That narrow signal matters because it shows whether the fix is working before monthly totals catch up.
Ask which defect is creating avoidable rework and weakening your payment position later. That answer sets the order of operations.
Linking RCM Metrics to Dispute and IDR Success
A specialty practice often realizes it has an IDR problem only after the first few cases go badly. The claims looked defensible. The balances were large enough to pursue. But once the team pulled the file, key support was inconsistent. Authorization notes were incomplete, modifiers varied by provider, and payment variance had never been tracked in a way that showed a repeat payer pattern. At that point, the dispute team is trying to rebuild proof after the fact.
That is the wrong point to start.
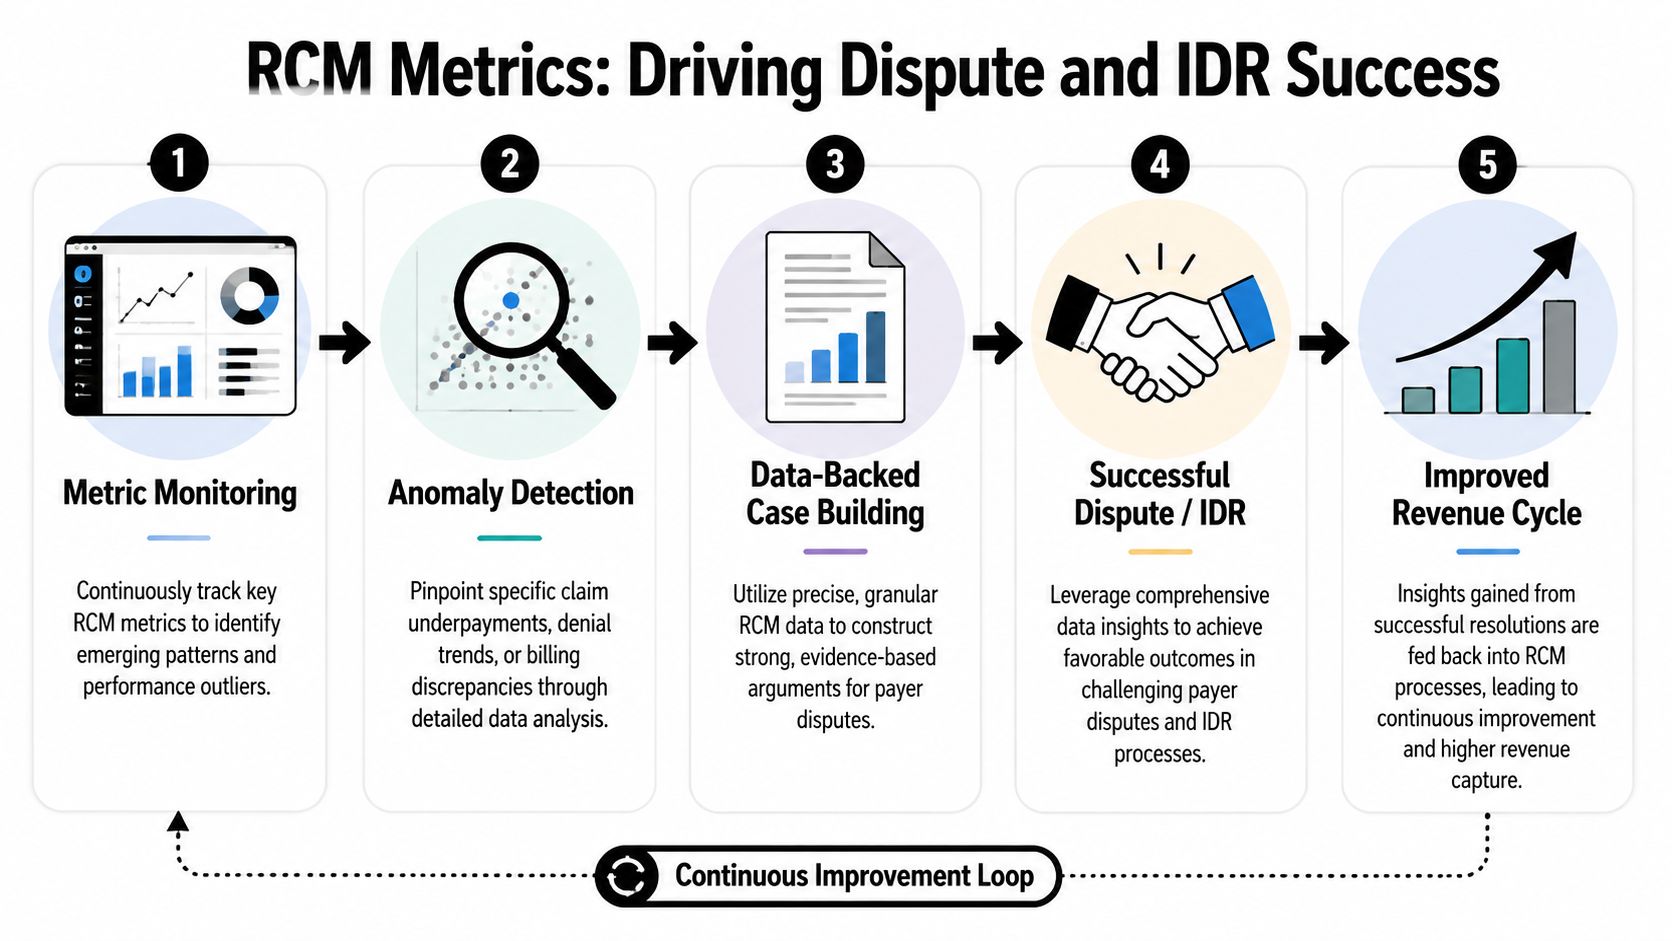
A dispute-ready claim starts at registration, coding, and claim submission. By the time an underpayment reaches appeal or IDR, the practice should already be able to show four things clearly: the claim was built correctly, the documentation supports the service, the submission met payer requirements, and the payment result broke from a consistent expectation.
The metrics that strengthen a dispute file
The best dispute evidence usually comes from routine operational data, captured consistently before anyone says the word arbitration.
- Clean claim rate: Shows whether the practice usually submits technically sound claims. That matters when a payer frames the problem as provider error.
- Payer-specific denial trends: Helps separate one-off denials from repeated payer conduct on the same service line, code set, or documentation issue.
- Underpayment variance tracking: Shows whether reimbursement is merely low or consistently below contract logic, historical payment patterns, or a qualified payment expectation.
- Net collection performance: Supports the financial impact story when payment friction is affecting actual cash, not just gross charges sitting on a report.
On their own, these metrics are operational. In an IDR file, they become evidence.
Why upstream discipline changes downstream outcomes
Independent Dispute Resolution gets stronger when the provider can show process integrity instead of making a broad complaint about unfair payment. Reviewers and payer counterparts respond better to a record that is orderly, repeatable, and specific.
For example, a clean claim rate issue points to internal execution. A narrow set of underpayments from one payer on the same CPT family points to payer behavior. That distinction matters because it changes the response. One problem calls for workflow correction. The other may justify escalation through appeals, audit, or a structured healthcare denial management process that preserves documentation and payment history for future disputes.
This is also where specialty practices gain an edge. They usually have narrower service mixes, more predictable payer edits, and higher-value claims. If the team tracks those services with discipline, it can show a much clearer pattern of inconsistent reimbursement than a generalist operation with scattered claim types.
What wins more often than volume
More filings do not usually produce better recovery. Better selection does.
Look for these signals before escalating a case set:
- Repeat payer conduct: The same payer applies the same adjustment logic across similar claims.
- Strong claim integrity: Registration, coding, modifiers, and supporting documentation are consistent.
- Clear financial harm: The payment gap is measurable across claims, not anecdotal.
- Closed-loop correction: Dispute outcomes feed back into edits, templates, education, and payer monitoring.
The trade-off is straightforward. Building this level of discipline takes more work upstream. It also cuts down on weak appeals, reduces avoidable arbitration expense, and gives the practice a stronger position when payment needs to be challenged formally. Metrics do more than monitor revenue cycle performance. They help prove which claims deserve to be defended, and which payer behaviors should be confronted.
Building Your Proactive Revenue Defense System
Reactive revenue cycle management feels busy because it is busy. Staff chase denials, rebill claims, answer payer requests, post partial payments, and work old balances that should never have aged that long. The organization spends energy fixing yesterday's preventable problems.
A proactive system works differently. It uses metrics to identify where claims become vulnerable, which payer behaviors require escalation, and which workflow changes will protect future reimbursement. That shift is the true value of disciplined revenue cycle management metrics.
The four core measures still matter. But they matter most when they're tied to ownership, specialty context, payer segmentation, and dispute readiness. A dashboard should tell your team where to act. A triage model should tell them what to fix first. A dispute strategy should rest on clean operational evidence, not last-minute reconstruction.
That's the change specialty practices need now. Stop treating metrics like a monthly report card. Use them as a revenue defense system that protects cash flow, exposes payer friction, and supports stronger recovery when payment falls short.
If your organization needs a tighter connection between day-to-day revenue cycle operations and payment enforcement, RevGuard works across RCM and IDR to help specialty providers build cleaner claims, track payer behavior, and turn underpayment patterns into actionable recovery strategies.