

The popular advice is simple: work denials faster, add staff, and push more appeals through the queue. That approach can recover some cash, but it treats the visible symptom as the business problem. A denial is often the final signal of an earlier failure in registration, eligibility, authorization, coding, documentation, billing, or payer configuration.
Denial management analytics changes the operating question from “How many denials did we touch?” to “Which preventable failures are creating the most unrecovered value, and which claims deserve the strongest evidence?” That shift matters because denial rates have remained a persistent revenue-cycle problem. Optum's 2024 Revenue Cycle Denials Index reported national denial rates of around 12% in 2023, compared with 10% in 2020 and 9% in 2016, while nearly half of denials were linked to front-end revenue-cycle issues, as summarized in Optum's denials analysis.
The answer isn't a larger post-denial worklist. It's a connected system that prevents avoidable denials before submission, prioritizes high-value recovery after payment failure, and preserves the evidence needed when a payer underpays or disputes reimbursement through Independent Dispute Resolution.
Why Working Denials Faster Is Not the Answer
A fast appeals department can still be an expensive cleanup department. If the same authorization gap, eligibility error, or coding mismatch keeps generating denials, increased productivity only helps the organization process the consequences more efficiently. The revenue leak remains upstream.
For years, denial volume has encouraged managers to focus on inventory, aging, and staff touches. Those measures matter, but they don't explain why claims fail or whether the recovery effort is financially rational. A claim denied for a correctable registration issue shouldn't receive the same workflow as a high-value clinical dispute, and neither should be evaluated only by whether someone opened the account.
The operational cost of a reactive model
A reactive model usually follows this sequence:
- The payer returns a reason code: Staff interpret the remittance and assign a work queue.
- The biller corrects or appeals: The team searches for missing information, documentation, or authorization proof.
- Leadership reviews totals: Managers see denial counts, appeal volume, and recovered amounts after the fact.
- The original process continues: Registration, scheduling, coding, or documentation teams receive little precise feedback.
That pattern creates three problems. First, it delays intervention until the claim has already consumed administrative time. Second, it hides repeatable patterns inside broad categories such as “authorization” or “eligibility.” Third, it encourages teams to measure activity rather than recovered revenue and prevented loss.
Practical rule: A denial queue should tell you what to do with a claim today, while analytics should tell you what to change before tomorrow's claims are submitted.
The scale of the problem reinforces the need for prevention. Experian's 2025 State of Claims survey found that 41% of providers said at least 10% of claims were denied, compared with 30% in 2022 and 38% in 2024. The same survey reported that 68% said submitting clean claims was harder than a year earlier. Those findings point to an upstream question that generic automation advice often avoids: which signals, by specialty and payer, predict failure before submission?
What prevention-focused analytics should produce
A useful program identifies risky combinations before billing, such as a payer-specific authorization rule paired with a particular service, modifier, location, or provider. It also records the evidence that supports payment, so a later dispute isn't rebuilt from scattered emails and attachments.
The objective is therefore broader than overturning denials. It is to engineer clean, traceable, dispute-ready claims. That requires connecting financial-clearance data, coding and documentation, claim edits, remittance results, appeal outcomes, and underpayment evidence in one operating model. Organizations that want to define the broader problem can use this practical explanation of revenue leakage in healthcare as a starting point.
Separating Payer Reason Codes from Root Causes
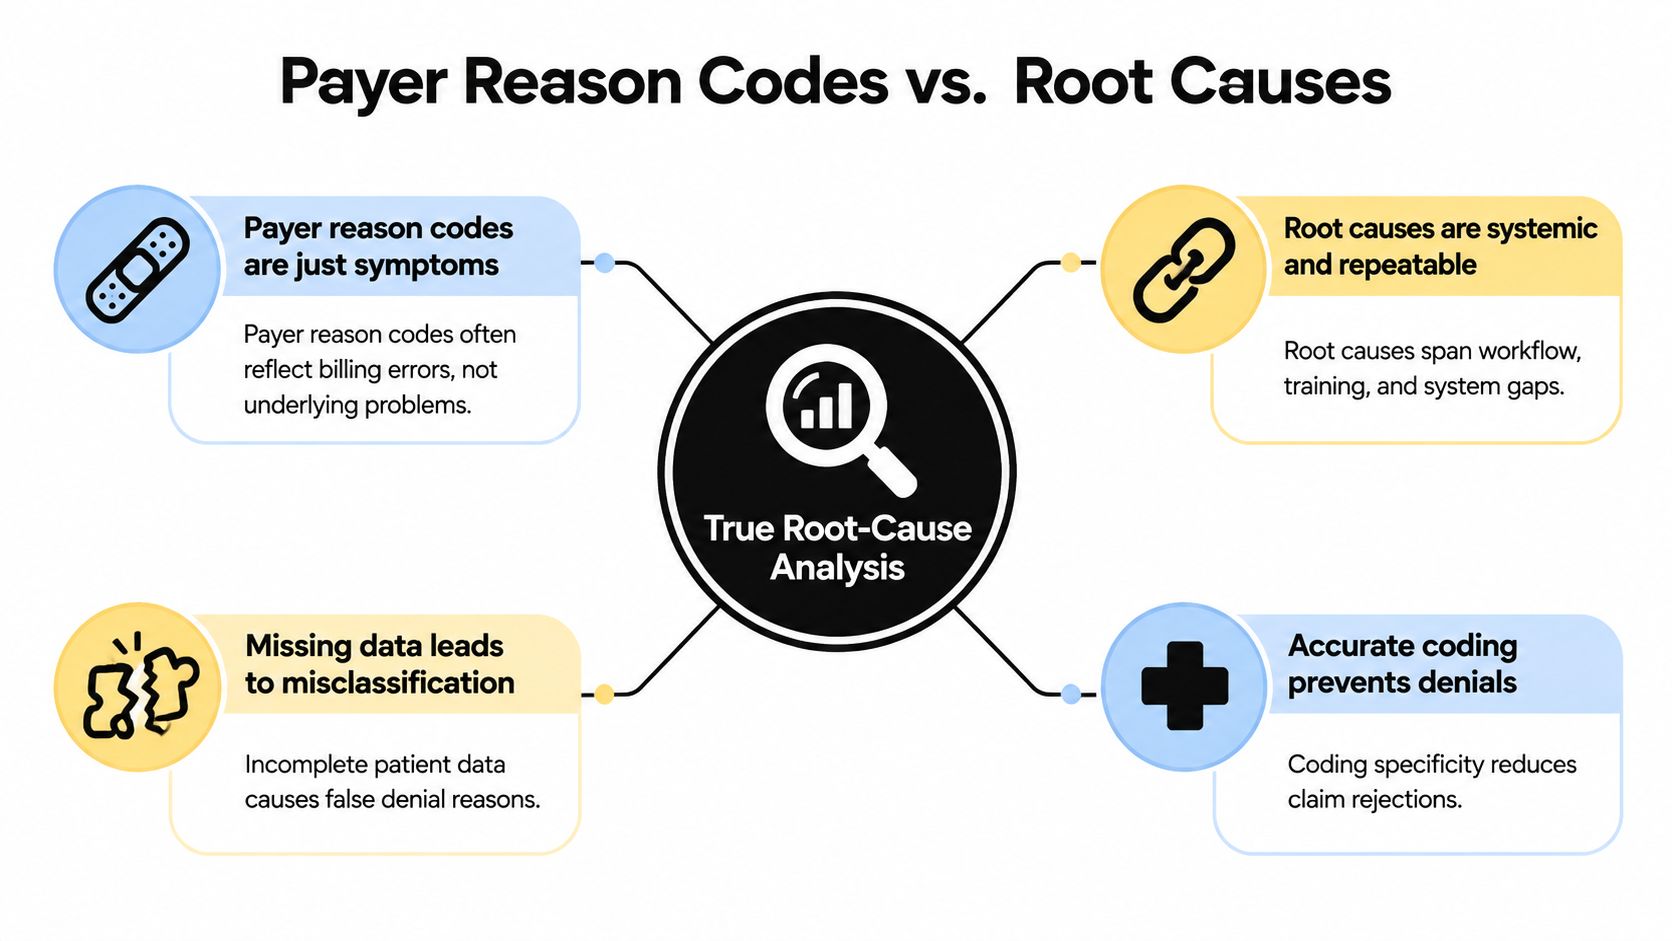
A payer reason code is an observation, not a diagnosis. It describes how the payer categorized a payment problem, but it may not identify the workflow failure that created it. Treating the code as the root cause is one of the fastest ways to build an inaccurate dashboard and assign the wrong owner.
A broad “authorization not obtained” category, for example, might reflect a missing authorization, an authorization attached to the wrong service, a date mismatch, an incomplete payer record, or a scheduling change that never reached the authorization team. Each problem needs a different correction. A single work queue cannot distinguish them without additional fields and operational context.
Build the analytical grain before building the dashboard
The data model should preserve both the payer's classification and the organization's interpreted cause. Expert guidance in the Physician Leadership Journal's root-cause analysis discussion supports segmenting denials by CARC/RARC, CPT, revenue code, modifiers, bill type, expected reimbursement, and actual payment.
That segmentation turns a generic denial count into an actionable decision:
- CARC and RARC: Preserve the payer's stated rationale, then compare it with internal review.
- CPT and revenue code: Identify services that repeatedly fail under specific payer rules.
- Modifiers: Detect whether distinct procedural, bilateral, assistant, or other modifier logic is producing avoidable edits.
- Bill type: Separate facility and professional billing patterns rather than blending unlike workflows.
- Expected reimbursement versus actual payment: Find underpayments that never become formal denials.
- Payer, location, and provider: Expose local configuration or training problems hidden by enterprise averages.
The internal cause should map to a process owner. Registration owns demographic and eligibility integrity. Authorization owns approval status, dates, and service alignment. Coding owns code and modifier accuracy. Clinical documentation teams own support for medical necessity. Billing owns claim construction, attachments, and timely submission.
Use a cause hierarchy instead of a flat list
A workable hierarchy has three layers. The first is the payer code. The second is the operational failure, such as an outdated eligibility response or missing authorization linkage. The third is the control weakness, such as unclear ownership, a broken interface, or a policy that staff can't interpret consistently.
This structure prevents a common analytical error: counting repeated denials as independent events when they represent one unresolved process defect. It also makes corrective action testable. If a team changes a registration workflow, the dashboard should show whether the related payer, service, and location combinations improve, not merely whether staff closed more accounts.
The same denial label can require different fixes. The useful question is not what the payer called it, but which internal step failed and who can change that step.
The KPIs That Drive Revenue Recovery
A denial dashboard should direct operating decisions, not decorate a monthly meeting. The measures that matter connect frequency, financial exposure, speed, and outcome. Counts show where denial activity is concentrated. Dollar-based measures show where cash is at risk. A practical healthcare revenue cycle analytics program brings both views together, then links them to prevention work and the evidence needed for downstream dispute decisions.
HFMA's standardization guidance for denial metrics and revenue-cycle benchmarking defines initial denial rate by claim count and dollars, and uses denial write-offs as a share of net patient service revenue to normalize performance across organizations. Those definitions prevent teams from treating a high volume of low-value denials as a larger financial problem than a smaller group of claims with greater reimbursement exposure.
Start with comparable definitions
Set the numerator, denominator, event date, and inclusion rules before comparing departments or payers. Calculate initial denial rate separately by claim count and denied dollars. Evaluate write-offs against net patient service revenue. Measure resolution speed from consistent start and end points.
A practical dashboard can use the following structure:
| KPI | Definition | Strategic Value |
|---|---|---|
| Initial denial rate by claims | Denied claims divided by submitted claims | Shows how often the first submission fails |
| Initial denial rate by dollars | Denied billed or expected dollars divided by submitted billed or expected dollars | Identifies financial exposure that claim counts can hide |
| Denial write-offs | Denial-related write-offs as a share of net patient service revenue | Normalizes leakage across organizations and service lines |
| Time from denial to appeal | Elapsed time between denial receipt and appeal submission | Reveals queue delays and missed recovery opportunities |
| Time from denial to resolution | Elapsed time between denial receipt and final resolution | Measures cash-flow drag and unresolved inventory |
| Overturn rate | Denials overturned through correction, appeal, or payer decision | Tests the quality of prioritization and evidence |
| Expected versus actual payment | Contracted or expected reimbursement compared with payment received | Surfaces underpayments that may not appear as denials |
Industry sources and medical-society summaries report that many organizations still experience initial denial rates of roughly 10% to 15%, while top performers target under 5%, as documented in the Physician Leadership Journal review. The same review associates eligibility and registration with about 18% to 29% of denial causes and prior authorization with about 13% to 42%. Those findings support Pareto analysis focused on the categories producing the greatest avoidable loss.
Turn KPIs into operating decisions
Every threshold needs an assigned response. A rise in initial denial dollars for one payer and CPT family should trigger payer-rule validation and coding review. A long time from denial to appeal calls for queue redesign. A strong overturn rate paired with slow resolution indicates that the evidence exists, but the workflow delays recovery. A weak overturn rate may reflect poor case selection, incomplete documentation, or a payer policy requiring escalation rather than repeated standard appeals.
Segment results by specialty, site, and payer instead of relying on one enterprise average. Compare like with like, then rank opportunities by expected reimbursement, recoverability, staff effort, and compliance risk. Track whether upstream clean-claim controls reduce the same denial patterns that later require appeal or Independent Dispute Resolution evidence packaging.
The goal is recovered revenue, not dashboard movement. A KPI earns its place when it changes prevention, prioritization, or evidence preparation and when the resulting action can be tied to cash collected.
Connecting Upstream Prevention to Downstream IDR
Independent Dispute Resolution created a reimbursement environment in which evidence quality, case selection, and payer behavior analysis directly affect financial strategy. The federal IDR process under the No Surprises Act became operational in April 2022, and Congressional Research Service reporting cited by Optum's IDR analysis says more than 2 million disputes were initiated through 2024, including over 1.46 million in 2024. Providers won about 80% of payment determinations in 2023 and about 85% in 2024, according to the same source.
Those figures don't mean every disputed claim should enter IDR. They show why a denial analytics program must extend beyond post-denial correction. The organization needs a reliable evidence layer that connects the original service, payer behavior, expected reimbursement, communications, documentation, and dispute result.
The data trail should begin before submission
Clean-claim prevention and IDR preparation use many of the same inputs. Eligibility and network status establish the financial context. CPT, modifiers, place of service, provider credentials, and documentation support the service description. Contractual expectations establish the payment comparison. Payer correspondence and prior determinations reveal behavior that can inform case selection.
A unified workflow should therefore:
- Flag upstream risk: Identify missing authorization, inconsistent eligibility, incomplete documentation, or payer-specific coding conflicts before submission.
- Preserve claim evidence: Store the relevant clinical, administrative, and billing records in a controlled case file.
- Measure payer behavior: Segment denials, underpayments, response patterns, and dispute outcomes by payer, service type, and time period.
- Score recovery value: Compare expected reimbursement, evidence strength, filing requirements, staff effort, and compliance considerations.
- Package and track disputes: Assemble the applicable evidence, record submission and response dates, and measure determinations by service and payer.
A fragmented RCM operation breaks down. A billing team may know that a claim was underpaid, while an IDR team lacks the structured record showing authorization history, service detail, payer communications, and expected payment. Conversely, an IDR win may never reach the upstream team as a payer-specific prevention rule.
The operating model described in healthcare denial management guidance treats prevention and recovery as one feedback loop. The same analytics layer should identify a claim likely to fail before submission and later explain whether the payer's payment decision deserves correction, appeal, negotiation, or IDR review.
A dispute file shouldn't be created from memory after payment fails. The evidence should accumulate as part of the claim lifecycle.
Prioritizing Analytics by Payer and Network Status
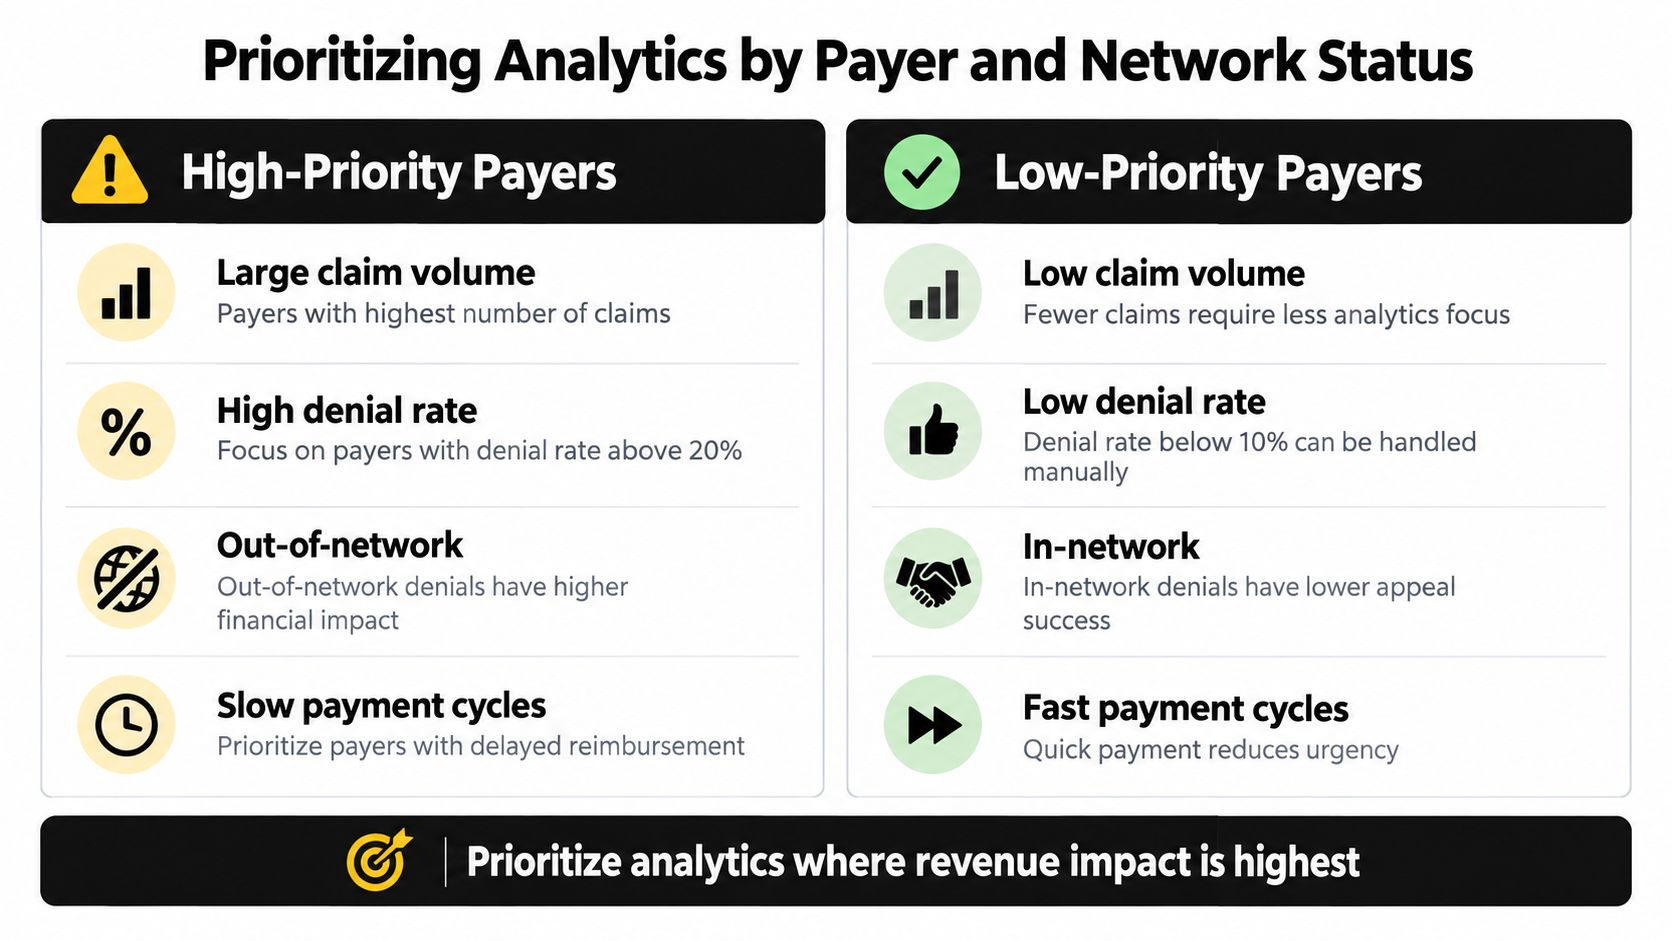
Not every denial deserves the same investment. A raw denial rate can identify friction, but it doesn't establish whether automation, manual review, payer escalation, or IDR preparation will produce the strongest return. The better question is where payer behavior, network status, service mix, and expected reimbursement intersect.
KFF reported that ACA Marketplace insurers denied 19% of in-network claims and 37% of out-of-network claims in 2024. The report also counted about 85 million in-network claims denied out of 496 million total claims, demonstrating why network status belongs in the analytical model rather than as a footnote. See the KFF analysis of Marketplace claims denials and appeals for the underlying figures.
Compare opportunity, not just volume
A high-volume payer with modest denial values may deserve preventive automation because repeated transactions create a clear pattern. A lower-volume out-of-network payer may deserve intensive case review because each denial carries greater reimbursement exposure or dispute importance. Neither should be prioritized from rate alone.
Use a payer-service matrix with these decision fields:
- Claim concentration: Which payer and service combinations create the most operational workload?
- Denied and underpaid value: What expected reimbursement is at risk, including claims that paid below contract or benchmark expectations?
- Preventability: Can registration, authorization, coding, or documentation teams change the outcome before submission?
- Recoverability: Does the organization have the evidence, filing pathway, and staff capacity to pursue payment?
- Payer behavior: Does the payer repeatedly deny the same service, modifier, location, or network category?
- Resource intensity: Will automation remove repetitive work, or will it create another exception queue that staff must manage?
The trade-off is straightforward. Generic AI can identify patterns, but it won't repair an unclear ownership model or compensate for incomplete source data. Automation works best when the organization has stable categories, reliable interfaces, clear escalation rules, and a defined action for every alert. Otherwise, the system may produce more flags without improving clean claims or recovery.
Allocate effort in tiers
High-priority opportunities typically combine meaningful claim volume, repeated denial behavior, material expected reimbursement, and a credible prevention or recovery action. Medium-priority opportunities may need sampling and monitoring until the pattern becomes clear. Low-priority categories can remain in a lighter-touch workflow when the value is limited and manual handling is more economical.
The analytics team should also test whether a payer-level pattern is a specialty or site-level issue. Pacific and Southern Plains markets have shown higher denial rates in Optum's historical index, which reinforces the need for payer and market-level revenue-cycle benchmarking rather than a uniform enterprise fix. A rule that helps one location may be inappropriate for another.
Building a Proactive Denial Prevention Workflow
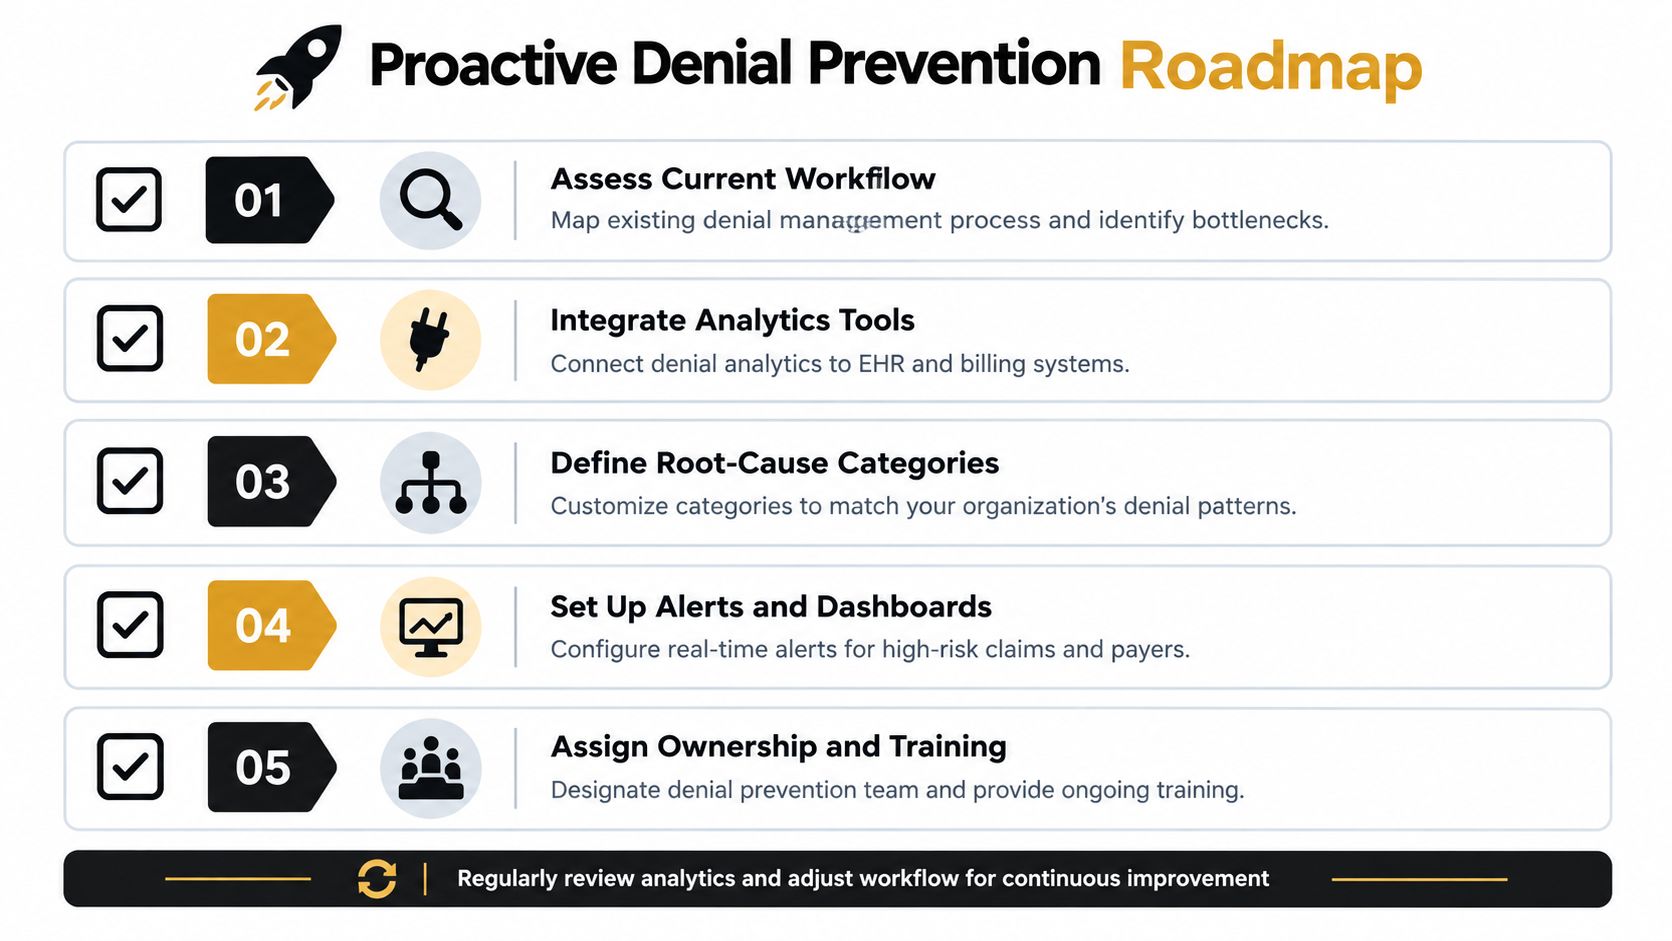
Buying a denial analytics platform doesn't create prevention by itself. The organization needs a daily operating rhythm that connects data to people, decisions, and follow-through. Without assigned ownership, dashboards become reporting tools that describe loss after the fact.
Start with the workflow, not the software. Map registration, eligibility, authorization, scheduling, clinical documentation, coding, claim edits, submission, remittance, appeal, payment variance, and IDR review. Mark where data is created, where it is changed, and where staff must make a judgment. Those handoffs often reveal why a denial appears to belong to billing even though the failure began earlier.
Put prevention into the daily workflow
A practical implementation uses a short, repeatable management cycle:
- Review new risk signals: Patient access and authorization leaders examine claims that match known payer, service, or documentation risks.
- Assign root-cause ownership: Each category has a named operational owner, not just a billing queue.
- Correct the source process: Teams change forms, work instructions, system edits, training, or escalation paths.
- Monitor the next results: Analysts compare the affected payer, service, location, and provider groups against the prior baseline.
- Capture recovery evidence: Appeals and IDR staff record what documentation, payment logic, and payer response influenced the outcome.
- Feed lessons upstream: Successful corrections become prevention rules, while failed appeals inform case-selection and documentation changes.
Daily huddles should focus on exceptions that require a decision. A useful agenda asks which new claims are at risk, which root causes increased, which owner is accountable, and whether the proposed intervention changed the financial result. It shouldn't become a recital of every open denial.
Build governance around specialty reality
A specialty group shouldn't borrow a hospital's denial taxonomy without testing it. Anesthesia, orthopedics, gastroenterology, dermatology, oncology, radiology, and air ambulance services have different documentation, authorization, network, coding, and reimbursement risks. Even within one specialty, payer rules and local workflows can vary by market.
Governance should establish:
- A controlled taxonomy: Keep payer codes intact, but maintain an internal root-cause hierarchy.
- A data dictionary: Define each KPI, date field, dollar field, and denominator.
- An escalation policy: Specify when staff correct, appeal, negotiate, or refer a case for IDR review.
- A feedback loop: Send confirmed causes to patient access, clinical, coding, and contracting leaders.
- A compliance review: Ensure automation and evidence packaging follow payer requirements and applicable No Surprises Act processes.
RevGuard's Business Analytics service is one example of a model that evaluates workflows, payer mix, denial patterns, accounts-receivable aging, and cash-flow trends, with dashboards for denial and underpayment analysis. Its broader operating approach connects specialty RCM with IDR case preparation and payer-behavior visibility, which fits organizations that need one lifecycle view instead of separate prevention and recovery programs.
The measure of maturity isn't dashboard complexity. It's whether a confirmed denial cause changes a workflow, prevents a repeat failure, or improves the quality of a recovery decision.
A proactive program will still have denials. The difference is that each denial produces usable intelligence, the organization can distinguish preventable loss from legitimate adjudication disputes, and leaders can direct staff toward the claims and process changes with the greatest reimbursement value.
If your team needs to connect clean-claim prevention, denial root-cause analysis, underpayment visibility, and IDR evidence packaging, review how RevGuard supports specialty healthcare organizations across the revenue lifecycle. Schedule a conversation to assess your payer mix, denial patterns, and recovery workflow, then identify the highest-value actions for protecting reimbursement.