
Denials used to be treated as friction. They now look more like a structural margin threat.
In 2025, 41% of providers said at least 10% of their claims were denied, up from 38% in 2024 and 30% in 2022, according to Experian Health's State of Claims 2025. The same survey found that 54% of providers said claim errors are increasing and 68% said submitting clean claims is harder than it was a year earlier. For practice managers, that combination matters more than any single denial percentage. It means the operating environment is getting less forgiving at the exact point where reimbursement pressure is already high.
Most organizations still separate denial prevention from denial recovery. That split is expensive. A weak registration workflow creates bad claims. Bad claims create denials. Denials trigger appeals, write-offs, patient balances, and staff rework. When underpayments or inappropriate payer decisions persist, some organizations also have to move into formal dispute pathways under the No Surprises Act. Financially, that is one connected process, not three different problems.
The right question isn't whether denials are rising. The data already answered that. The useful question is how to build a revenue cycle that protects revenue from first registration through final payment enforcement.
The Rising Tide of Health Insurance Denials
A rising denial rate rarely starts in the denial workqueue. It usually starts upstream, with small defects that make a claim easier for a payer to stop, pend, reduce, or reject under manual review. Eligibility data is incomplete. Authorization is attached incorrectly. A modifier is technically valid but mismatched to payer policy. By the time the issue shows up as a denial, the financial damage has already spread across A/R days, staff labor, patient confusion, and avoidable write-off risk.
For practice managers, that matters because denials are not an isolated billing problem. They are a margin-control problem. Every denied or delayed claim creates at least three costs at once: deferred cash, rework expense, and a higher chance that part of the balance shifts to patient collections or bad debt. In high-acuity specialties, surgery, and ambulatory settings, a small increase in denial volume can have an outsized effect because the dollars attached to each claim are larger and the payer rules are less forgiving.
Why this trend hits practice margins fast
The operational pattern is consistent across many groups. Front-end teams collect data. Coding and billing submit a claim that appears acceptable. The payer responds with a denial, a request for records, a downcode, or a payment short of contract expectations. Staff then spend days determining whether the root cause sits with registration, authorization, documentation, coding, payer edits, or payer behavior. Meanwhile, cash is delayed and the patient may receive a statement based on an adjudication that will later be corrected.
That is why denial growth should be read as a revenue signal, not just a workflow issue.
A claim that misses on first pass costs more than the appeal effort. It also distorts reporting, inflates follow-up inventory, increases call volume, and pulls experienced staff into preventable correction work instead of higher-yield recovery activity.
What denial growth actually signals
Higher denial pressure usually means the tolerance for process variation has narrowed across the entire revenue cycle. The organizations that respond best do not treat prevention, appeal, underpayment review, and formal dispute action as separate programs. They treat them as one connected revenue protection system.
That distinction becomes even more important when ordinary appeals fail. If a payer's position crosses from routine denial activity into underpayment or inappropriate out-of-network reimbursement, the recovery path may extend beyond standard follow-up and into enforcement mechanisms such as the No Surprises Act's Independent Dispute Resolution process. Financially, the handoff between clean claim creation, denial management, and payment enforcement should be deliberate. If those functions operate in silos, revenue leaks at every transition.
The practical implication is simple. Practices that only measure denials after adjudication usually react too late. Practices that trace denial patterns back to intake, coding, authorization, contract terms, and payer dispute rights protect more net revenue per claim.
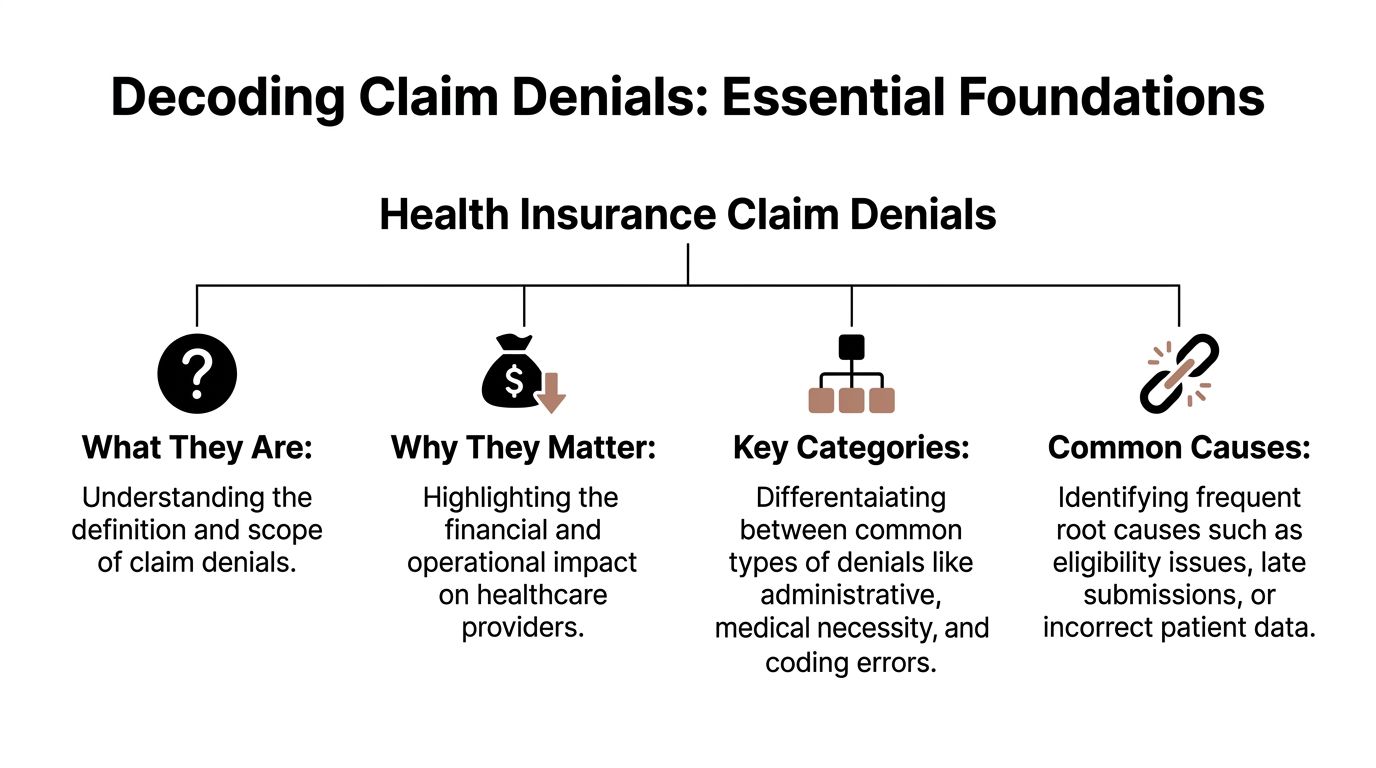
Decoding Health Insurance Claim Denial Rates
Practice managers need cleaner definitions before they can trust any dashboard. Too many organizations mix rejections, denials, and underpayments into one operational bucket. That makes trend analysis almost useless.
Think of claims like packages moving through an inspection center. A rejection is a package turned away at the door because the label is incomplete, unreadable, or missing required data. It never enters the payer's adjudication workflow in a meaningful way. A denial is different. The package was received, opened, reviewed, and the payer determined it wouldn't pay as billed.
The metrics that matter
A few terms deserve precise use:
- Initial denial rate: The share of claims denied on first adjudication. This is the best early warning signal for front-end process failure and payer friction.
- Final denial rate: The share of claims that remain unpaid after all normal follow-up, corrections, and appeal activity. This is closer to true revenue loss.
- Clean claim rate: The share of claims submitted without errors that would predictably interrupt payment. This is an upstream quality measure, not just a billing metric.
- Denial overturn rate: The share of denied claims that are later paid after correction or appeal. This tells you whether your follow-up operation is effective or just busy.
Payer mix changes the baseline
Health insurance claim denial rates are not uniform across payers. That point is often missed when leadership compares one blended denial percentage quarter over quarter. An organization with more Marketplace exposure should expect a different denial profile than one with mostly commercial PPO volume.
Independent industry analysis cited by ASHEcon found that in 2022 to 2023, initial denial rates averaged 14% for commercial claims, 16% for Medicare Advantage claims, and 20% for ACA Marketplace claims. The same reporting noted that in 2023, about 19% to 20% of in-network HealthCare.gov claims were denied, totaling roughly 49 million denied in-network claims across ACA marketplace plans, according to ASHEcon's review of denial-rate reporting.
That should change how managers read their own numbers. A single enterprise denial rate can hide where losses are concentrated.
What to ask your team
When a billing team says, "Our denial rate is high," that isn't enough. Ask for segmentation:
- By payer: Which contracts produce the most initial denials?
- By service line: Which specialties create the most avoidable rework?
- By denial family: Are problems administrative, coding-related, benefit-driven, or clinical?
- By final outcome: Which denials are corrected and paid, and which become write-offs?
A denial rate without segmentation is a status report. A denial rate with segmentation is a management tool.
Why Payers Deny Claims A Look at Common Causes
The industry often talks about denials as if prior authorization explains most of the problem. Public data suggest a broader and more operationally important picture. In ACA marketplace plans, in-network denial rates were 19% in 2024 and 20% in 2023, while out-of-network denials were 37% in 2024. But insurer reason codes were dominated by “Other” at 36% and administrative reasons at 25%, with only 9% tied to prior authorization or referral and 5% to medical necessity, according to KFF's analysis of claims denials and appeals in ACA Marketplace plans in 2024.
That has a direct operational implication. If your denial committee assumes most denials are clinical disputes, it may overinvest in physician appeal letters and underinvest in front-end workflow controls, coding accuracy, and payer-specific edit logic.
Administrative causes are often the biggest leak
Administrative denials are the most frustrating because many are preventable and many are expensive to rework. These include eligibility mismatches, missing coordination-of-benefits detail, demographic discrepancies, filing issues, authorization mismatches, provider enrollment problems, and plan-specific billing requirements.
If you want one place to tighten quickly, start with front-end data integrity and payer rule compliance. A strong medical eligibility verification workflow won't eliminate denials, but it can remove a large share of avoidable administrative failures before the claim reaches adjudication.
Coding and benefit interpretation matter more than many teams think
Coding-related denials often hide behind vague payer language. A denial may be labeled "not covered," "bundled," or "other," even when the practical issue is modifier logic, diagnosis support, frequency limits, place-of-service mismatch, or an internal payer edit applied inconsistently.
Benefit design also creates denials that staff may misclassify as simple nonpayment. The claim may have been processed exactly as the payer intended, but not as the provider expected. That distinction matters because the response differs. Some claims need correction. Others need appeal. Others need contract or policy escalation.
| Denial Reason Category | Example Payer Justification | Potential Root Cause | Where to Investigate |
|---|---|---|---|
| Administrative | Coverage not active on date of service | Eligibility not rechecked, COB issue, patient data mismatch | Registration workflow, eligibility logs, payer response files |
| Authorization | Authorization missing or invalid | Wrong CPT linked, units mismatch, service date issue | Scheduling, auth team notes, referral record |
| Coding | Procedure inconsistent with modifier or diagnosis | Edit-rule failure, unsupported diagnosis, bundling confusion | Charge review, coding audit, scrubber edits |
| Benefit or plan rules | Service not covered under plan | Benefit limitation, frequency maximum, plan exclusion | Eligibility response, benefit verification notes, payer manual |
| Medical review | Not medically necessary | Documentation gap, payer guideline mismatch | Clinical record, appeal packet, utilization notes |
| Other or unclear | Other | Payer opacity, mixed causes, inaccurate reason mapping | EOB library, denial taxonomy, payer trend review |
Why vague reason codes deserve extra scrutiny
"Other" isn't a root cause. It's a signal that your reporting taxonomy is too dependent on payer wording. Strong denial analytics require remapping payer language into categories your operation can act on.
When a payer says "Other," your team still has to decide whether to fix registration, revise coding, challenge adjudication, or escalate the issue. The work doesn't disappear because the explanation is vague.
The organizations that recover more revenue don't stop at the payer's reason text. They trace each denial back to the specific workflow, rule set, or payer behavior that produced it. That is where prevention starts.
How to Measure and Analyze Your Denial Rate
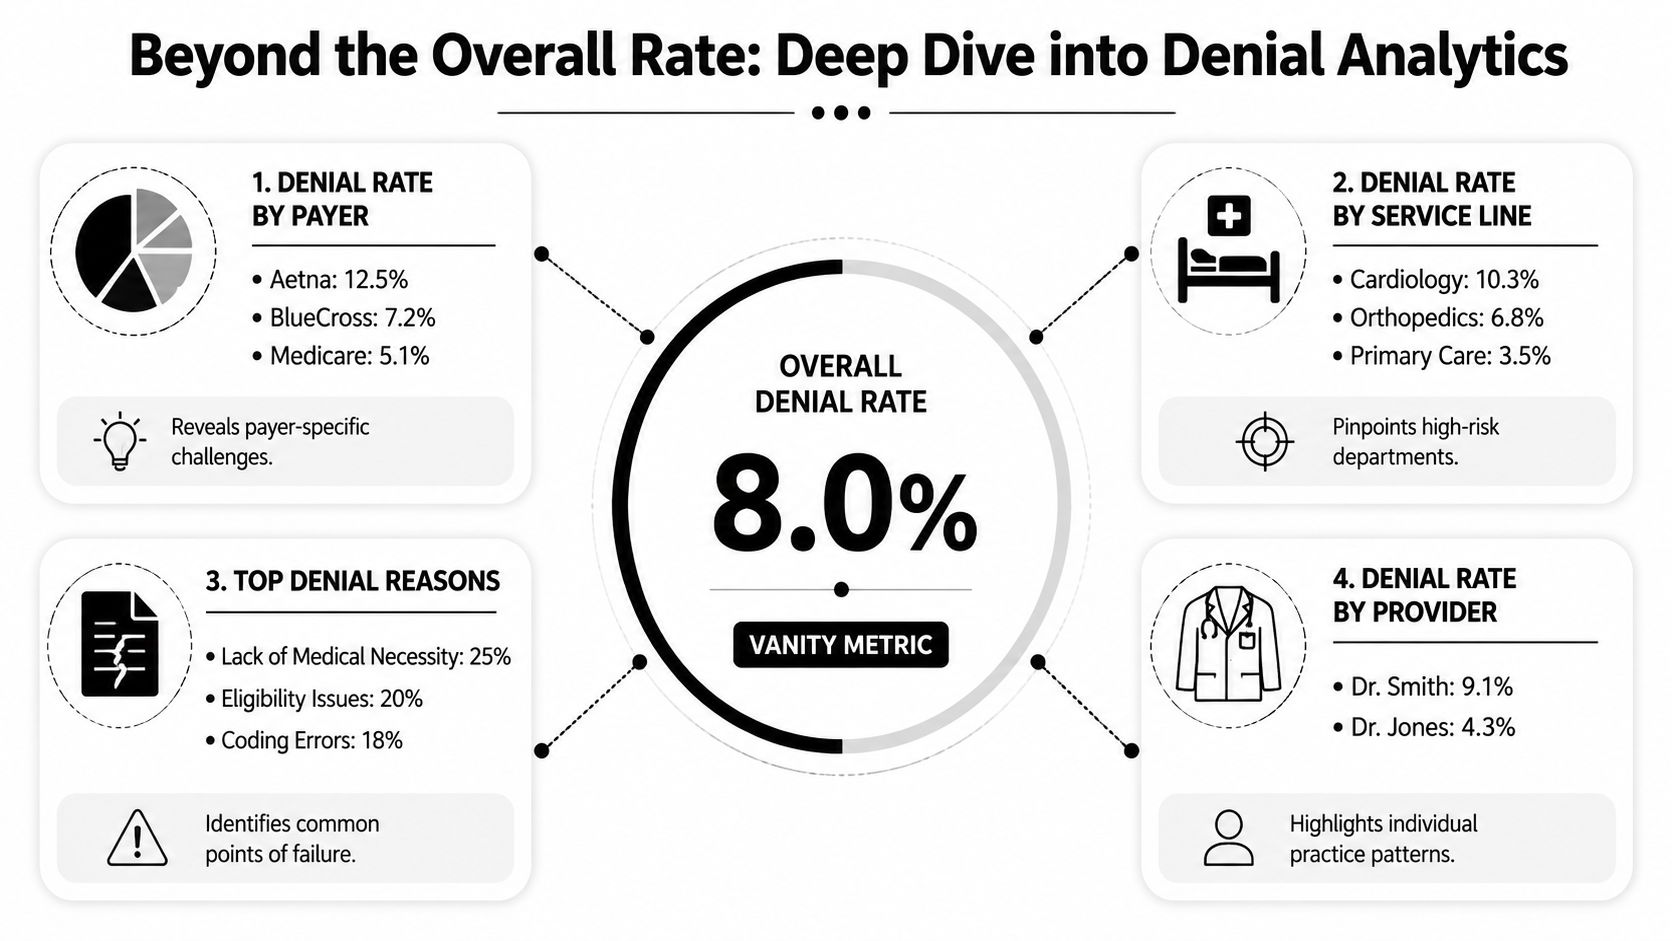
An overall denial rate is useful for board slides. It's weak as a management instrument. Revenue recovery happens when the team can isolate who denied, what was denied, why it was denied, whether it was corrected, and how much cash remained exposed after the denial.
Start with a denial analytics stack
A reliable reporting package should segment denials at least five ways:
By payer
This shows whether the issue is broad process drift or concentrated payer behavior.By CPT or service family
This reveals where coding, authorization, or coverage rules create recurring leakage.By rendering provider or location
Use this carefully. The goal isn't blame. It's to spot documentation habits, scheduling patterns, or charge capture inconsistencies.By denial category
Your internal taxonomy should be more useful than the payer's EOB language.By outcome
Track corrected and paid, appealed and paid, partially paid, patient responsibility, and final write-off.
A detailed understanding of the claim adjudication process helps here because denial analytics should mirror the points where claims can fail, from submission edits to adjudication to payment posting.
Focus on financial exposure, not just denial counts
A small category of denials can create a large share of lost cash if those claims carry higher reimbursement or trigger patient balance transfer. That is why count-based reporting should always sit beside dollar-based reporting.
KFF-linked denial data summarized by ValuePenguin show that about 19% of in-network marketplace claims were denied in 2023. For practice operations, a peer-reviewed analysis cited there found that only 32.4% of denied claims were resubmitted, and denied claims had unpaid patient portions 92.85% of the time, with a mean bill of $1,395. The operational message is clear. A denied claim isn't only a payer payment issue. It often becomes a patient balance problem too.
Questions every practice manager should ask monthly
Use your denial review like a performance meeting, not a claims inventory check.
- Which payers produce the most high-dollar initial denials?
- Which denial categories have the lowest recovery rate after follow-up?
- Which CPTs generate repeated avoidable denials despite prior fixes?
- How long does each denial family sit before first action?
- Which denials are being shifted to patient responsibility, and were they patient-responsibility events?
Operational test: If your team can't show denial outcomes by payer, denial family, and dollars at risk, you're probably measuring activity instead of recoverability.
Build a feedback loop
The value of denial analytics appears when findings move upstream. If one payer repeatedly denies a narrow service family for administrative reasons, scheduling, registration, coding, and billing should all see that pattern. Analytics should change behavior. Otherwise reporting becomes a monthly archive of preventable loss.
Proven Strategies to Reduce Denials and Recover Revenue
Denial reduction isn't one tactic. It is a connected revenue protection model with three layers: prevent avoidable denials, recover payable claims quickly, and enforce payment rights when ordinary workflows fail. Teams that separate those layers usually underperform because each one depends on the quality of the one before it.
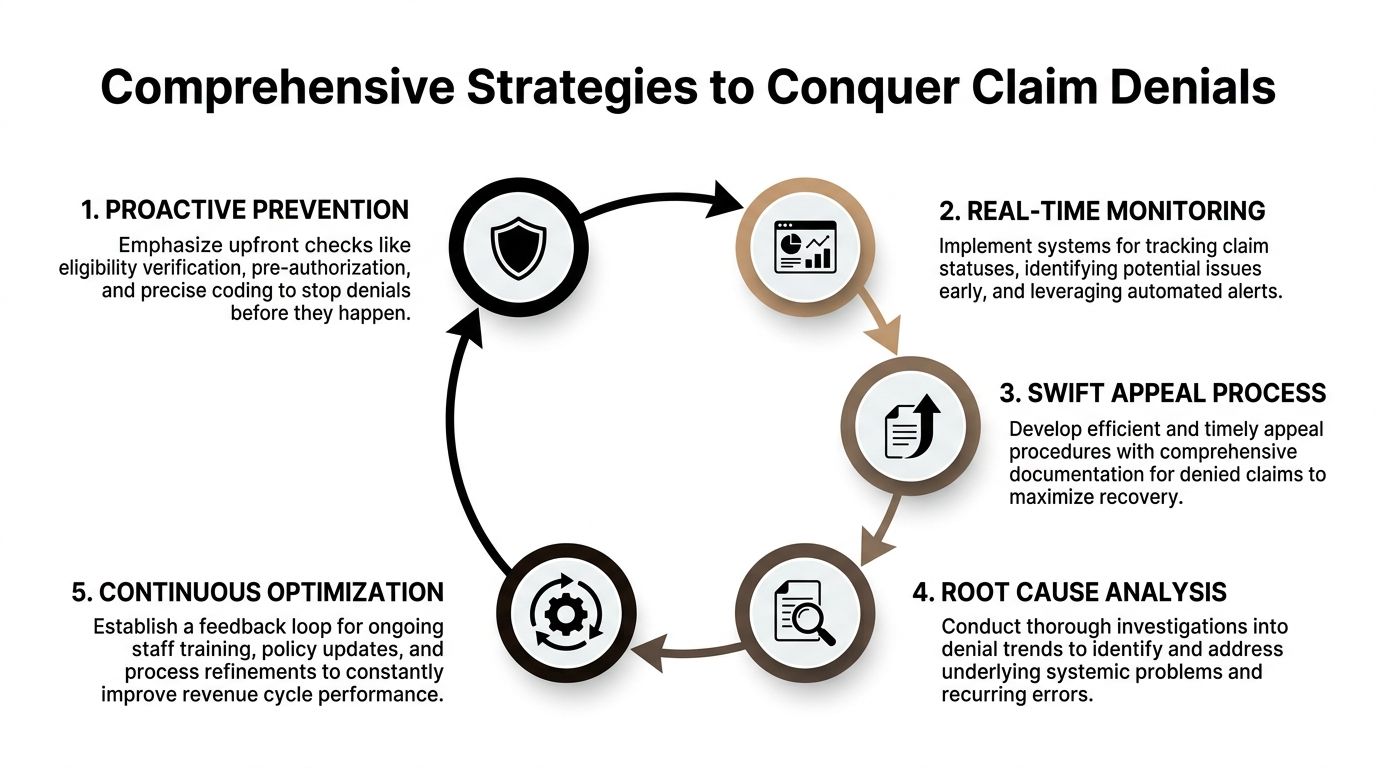
Layer one means clean claim engineering
Prevention starts before the claim exists. Registration has to capture accurate demographics, payer identity, coordination of benefits, and plan-specific requirements. Scheduling has to support authorization and referral needs. Coding has to reflect the clinical record precisely enough to survive payer edits and medical review.
This work is often described as "front-end," but financially it's not front-end. It's the first defense against rework, delayed cash, and downstream dispute costs.
A strong prevention model usually includes:
- Eligibility discipline: Recheck coverage against the date of service and benefit context, not only at initial scheduling.
- Authorization control: Match the approved service, units, and dates to what is performed and billed.
- Coding precision: Audit modifiers, diagnosis linkage, place of service, and procedure combinations that trigger recurring edits.
- Documentation readiness: Ensure records support not just coding, but also later appeal or dispute if the payer challenges the claim.
- Payer rule libraries: Keep local intelligence on payer-specific edits, filing rules, and documentation expectations.
Layer two requires selective, evidence-based recovery
Not every denial should receive the same response. Some claims need a corrected submission. Some need a formal appeal. Some need escalation because the payer's stated reason doesn't match the contract, the medical record, or the facts of the encounter.
The most efficient teams triage denials by recoverability and likely path to payment. They don't let every denial enter the same queue.
A mature healthcare denial management approach should distinguish between:
- quick-fix denials that can be corrected and resubmitted,
- clinical denials that need medical support,
- payer pattern denials that merit escalation and trend review,
- underpayments or adverse determinations that may require formal dispute strategy.
Layer three is enforcement, not just appeals
This is the part many organizations still treat as separate legal or compliance work. It shouldn't be separate. In specialties and encounter types affected by the No Surprises Act, the Independent Dispute Resolution process can function as a payment enforcement mechanism when the payer's position isn't corrected through ordinary follow-up.
That changes how claims should be built from the beginning. A dispute-ready claim needs clean eligibility evidence, coding support, documentation integrity, and a record of payer behavior. In other words, the same discipline that lowers avoidable denials also improves the organization's position if the claim later moves into formal dispute.
The strategic insight is simple: RCM and payment enforcement are one continuous revenue process.
Why the integrated model matters
On the federally reported ACA marketplace dataset, the average in-network claims denial rate was about 18%, but some plans denied as much as 80% of in-network claims, according to AHA reporting on CMS claims denial data. The same reporting noted that consumers rarely appeal denied claims and insurers usually uphold denials when they do appeal.
Providers can't afford that passivity. If an organization relies only on clean claims, it leaves money behind when payers deny or underpay anyway. If it relies only on appeals, it spends too much fixing avoidable errors. If it treats dispute rights as exceptional events, it misses an essential backstop.
Build the claim as if it may need to be defended later. That mindset improves both first-pass payment and downstream recovery.
A practical operating model
For practice managers, the strongest model usually looks like this:
- Prevent what should never deny
- Correct what can be fixed quickly
- Appeal what should pay on the merits
- Escalate repeated payer behavior
- Use formal dispute mechanisms when payment rights require enforcement
That is how denial reduction turns into revenue protection.
Building a Denial-Resistant Revenue Cycle
A denial-resistant revenue cycle protects margin by treating reimbursement as a controlled process, not a series of isolated fixes. The organizations that outperform peers usually do four things well: they prevent avoidable denials, prioritize rework by dollar value, document medical necessity and coverage support before submission, and preserve a clear path to escalation when a payer still refuses to pay correctly.
That operating model matters because denial management is not just an administrative function. It determines how much earned revenue reaches the bank, how long cash stays tied up in A/R, and how much staff time gets consumed by rework that should have been avoided upstream. A practice can post acceptable charge volume and still underperform financially if preventable denials, slow appeals, and underpayments are handled by separate teams with separate priorities.

The strongest revenue cycles are built around feedback loops. Front-end errors should change registration workflows. Coding denials should change documentation habits. Repeated payer edits should change claim scrubber rules, contract review priorities, and appeal templates. If denial data never changes upstream behavior, the same dollars will keep leaking out of the system.
The other discipline is escalation. Some claims should be corrected and resubmitted quickly. Some require a medical necessity appeal. Some reflect a payer pattern, such as repeated downcoding, delayed adjudication, or underpayment against plan terms. Those cases call for more than routine follow-up. They require a documented enforcement path that can support formal dispute activity, including No Surprises Act IDR when the claim qualifies. That is where the article's central point becomes operational: clean claim creation, denial prevention, appeal management, and payment enforcement belong in one revenue strategy.
For practice managers, the financial question is straightforward. Which denials can be eliminated, which should be appealed, and which should be escalated because the payer's behavior will keep eroding yield if no one challenges it? Teams that answer those questions consistently recover more revenue with less waste.
RevGuard helps provider groups, hospitals, ASCs, and multi-state platforms connect denial prevention with final payment recovery. Its model combines specialty-specific RCM work, including eligibility, coding, credentialing, billing, and collections, with enforcement-driven IDR under the No Surprises Act when payers delay, deny, downcode, or underpay. If your organization needs a tighter system for turning clean, dispute-ready claims into more reliable reimbursement, explore RevGuard.