

Systematic underpayments in U.S. healthcare are estimated at $150–$250B annually, and 68% of healthcare leaders struggle to extract specialty-specific insights from their current dashboards, according to the 2024 KLAS report on revenue cycle analytics. That changes the conversation. Revenue cycle analytics isn't a reporting upgrade. It's a revenue defense function.
Generic dashboards usually tell leadership that denials are up, A/R is aging, or collections are uneven. Specialty operators need something else. They need analytics that can isolate payer behavior by code, modifier, place of service, authorization pathway, and clinical scenario, then feed that intelligence back into claim design and forward into dispute strategy.
The Hidden Drain on Your Practice Revenue
A practice's margin usually slips through hundreds of small payment failures, not one headline event. One claim goes out with an incomplete authorization trail. Another is paid below the expected amount for the code, modifier, and place of service. A third is denied, then written off because the team can see the loss but cannot prove the payer is repeating the same behavior across similar claims.
That pattern is where specialty groups get hurt.
As noted earlier, many revenue cycle leaders still struggle to pull specialty-specific insight from standard dashboards. In anesthesia, that often means recurring variance tied to time units, modifiers, medical direction, or documentation handoff gaps between the facility and billing team. In air ambulance, it can mean claims that look paid on a dashboard but still fall short once you compare the remittance against the expected payer logic, case facts, and the insurance allowed amount that should anchor reimbursement review.
Why generic visibility isn't enough
Revenue cycle leaders need answers to two different questions. What happened on the claim. What pattern is the payer establishing across this service line, plan type, and claim configuration.
Generic dashboards usually stop at counts and aging. They can show a denial category climbing or a payer lagging in adjudication. They usually cannot separate a documentation flaw from a payer editing habit, a contract variance, or a downstream underpayment strategy that only shows up in one specialty.
That distinction matters because the fix changes with the cause. If an anesthesia group sees repeated denials on high-acuity cases, the problem may sit upstream in how concurrency, provider role, or preauthorization details are captured before submission. If an air ambulance provider sees partial payments on transport claims with similar clinical facts, the issue may be payer patterning that requires organized evidence for appeal and, when appropriate, NSA-compliant IDR. Without that level of analysis, teams end up treating every claim as a one-off exception.
What financially disciplined organizations do differently
They study payer conduct across the full revenue cycle, from claim build to final resolution.
In practice, that means connecting front-end claim quality with back-end recovery strategy. An orthopedic group may find that a downcoding trend starts with missing operative detail that weakens code support before the claim ever leaves the practice. An anesthesia group may learn that one payer consistently challenges specific modifier combinations unless documentation arrives in a payer-specific format. An air ambulance operator may see that the same payer pays quickly but underpays in a repeatable way, which changes the workflow from basic follow-up to structured variance review, escalation, and dispute preparation.
The goal is not more reporting. The goal is targeted analytics that show where revenue is leaking, why it is leaking, and which operational change or payer challenge will stop it.
What Is Healthcare Revenue Cycle Analytics Really
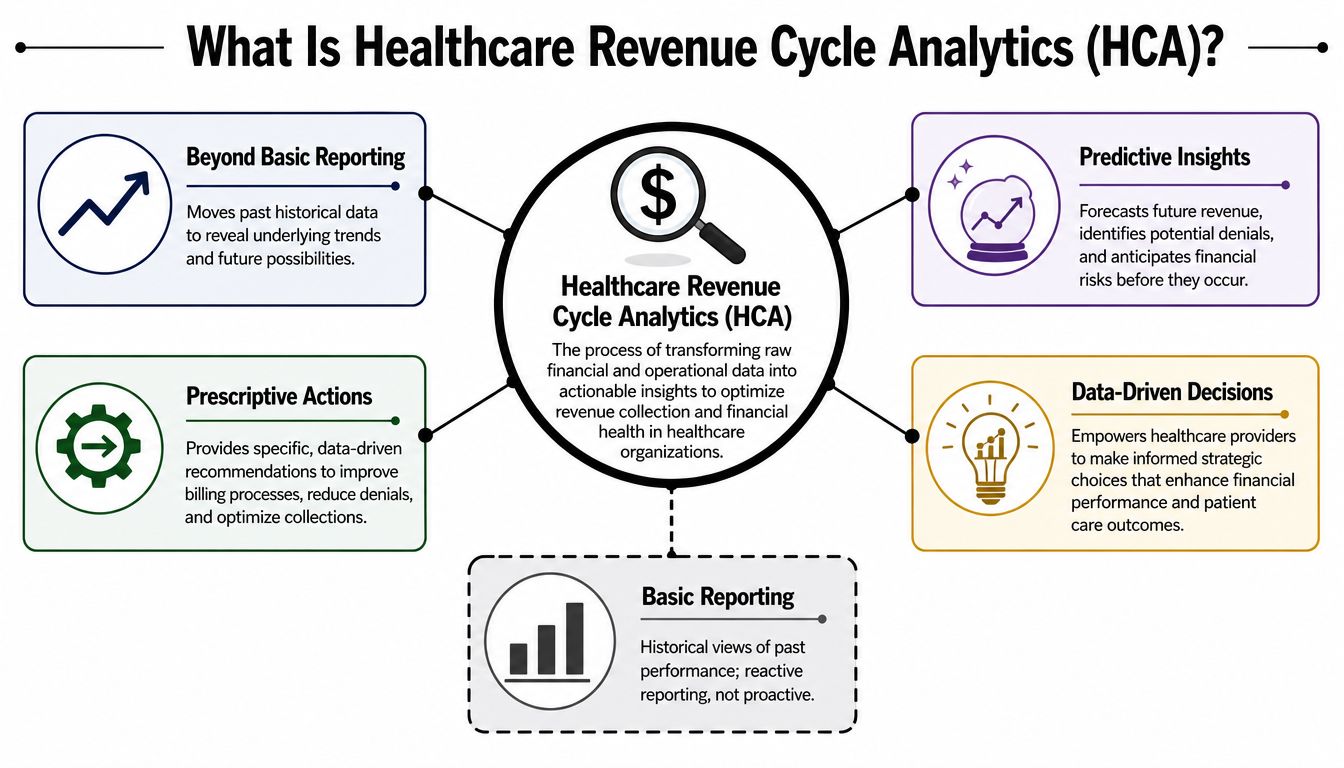
Healthcare revenue cycle analytics is the process of turning operational and financial data into decisions that improve reimbursement. Done well, it doesn't just show historical performance. It explains root causes, predicts risk, and tells teams where to intervene before revenue is lost.
A basic dashboard is like a weather app that tells you it rained yesterday. Real analytics is closer to an aviation forecast. It tells you where turbulence is forming, which route is unsafe, and what adjustment avoids the problem before takeoff.
Reporting versus analysis
A reporting tool usually answers questions like these:
- How many claims were denied
- What are current A/R balances
- Which payer has the longest reimbursement lag
Useful, but incomplete.
A true analytics model goes further:
- Root cause isolation identifies whether denials cluster around eligibility, coding, authorization, modifier use, or documentation quality.
- Payer pattern detection surfaces repeat behavior by payer, plan, code set, and facility or provider context.
- Pre-submission intervention flags claims likely to fail before they ever reach the payer.
- Post-payment variance review detects underpayments that a broad KPI dashboard would miss.
Why unified data changes the game
Specialty practices often work across separate systems for scheduling, documentation, billing, claims, and payment posting. That fragmentation is one reason teams stay stuck in manual audit mode.
A healthcare revenue cycle analytics analysis from Greenhive Billing describes a more effective model: consolidating EHR, billing, and scheduling data into a unified platform enables predictive analytics that can forecast denials and underpayment scenarios while reducing manual processes by up to 90%. The operational value isn't just speed. Unification lets a team connect the denial to its real upstream cause.
Practical rule: If your analytics can't trace a denial back to a specific workflow failure, it isn't mature enough to protect specialty reimbursement.
What specialty leaders should look for
If you're evaluating healthcare revenue cycle analytics, don't start with visuals. Start with decision usefulness. A clean-looking dashboard can still be financially weak.
Ask whether the platform can support the revenue cycle management metrics that matter at a payer and procedure level, not just an enterprise summary. In practice, that means it should let your team drill from organization-wide denial rates into a narrower question such as: "Which payer is repeatedly downcoding this procedure when modifier usage and documentation look compliant?"
The best analytics environments also preserve claim lineage. Teams need to see the full path from eligibility and authorization through coding, adjudication, appeal, and final payment. Without that chain, the organization may know a problem exists but still miss the critical juncture that fixes it.
Tracking KPIs That Actually Drive Profitability
Most KPI packs are too broad to help a specialty practice recover margin. They emphasize executive summaries because those are easy to distribute. Profit protection requires narrower measures that connect payment behavior to operational action.
A strong KPI set should make it possible to answer three questions quickly. Which payer is creating avoidable friction? Which claim types are leaking revenue? Which part of the workflow needs to change first?
The KPI table that matters
| KPI | What It Measures | Why It Matters |
|---|---|---|
| Net collection rate by payer | How much of expected reimbursement is actually collected from each payer | Exposes payer-specific performance gaps that disappear in blended averages |
| Denial rate by CPT or service category | How often claims are denied for specific procedures or service lines | Helps isolate denial-prone services in anesthesia, orthopedics, imaging, or air ambulance |
| Underpayment variance by payer and code | Difference between expected and actual reimbursement at a detailed claim level | Detects silent leakage from downcoding, partial payment, or inconsistent adjudication |
| First-pass acceptance trend | Share of claims that move cleanly through initial submission | Shows whether upstream registration, authorization, and coding controls are working |
| Authorization-related denial pattern | Denials tied to prior auth, eligibility, or medical necessity workflow breakdowns | Pinpoints front-end process failures that create downstream write-offs |
| Payment velocity by payer | How quickly each payer turns submitted claims into cash | Helps prioritize follow-up based on collectability and delay behavior |
| Appeal overturn pattern | Which denial types are reversed and under what documentation conditions | Distinguishes defendable denials from preventable ones |
| A/R aging by value and payer behavior | Aging receivables sorted by collectible value, not just age bucket | Prevents teams from wasting effort on low-yield accounts while high-value claims stall |
How to read KPIs together
One KPI almost never tells the full story. The useful signal comes from combinations.
For example, a rising denial rate by procedure may look like a coding issue. Pair it with payer-level underpayment variance and authorization denial pattern, and the picture may change. You may find that only one payer is affected, only one code family is involved, and the underlying issue is inconsistent medical necessity review rather than coder accuracy.
That distinction matters because each problem has a different remedy:
- Coding error pattern calls for claim edit redesign, coder education, or documentation query support.
- Payer-specific downcoding calls for expected reimbursement modeling and stronger post-adjudication review.
- Authorization drift calls for front-end workflow controls, not more appeal labor.
Vanity metrics to demote
Some metrics look important but don't help teams act.
A denial rate without denial reason segmentation is a headline, not an operating tool.
The same goes for organization-wide A/R numbers that don't distinguish low-value balances from disputed high-dollar claims, or net collection summaries that blend multiple payer behaviors into one average. These aren't useless. They're just not enough for specialty decision-making.
In my experience, the fastest way to improve a KPI review meeting is simple: every metric on the page should lead to a named owner, a likely root cause, and an operational next step. If it can't do that, it's reporting clutter.
Integrating Analytics with RCM and IDR Workflows
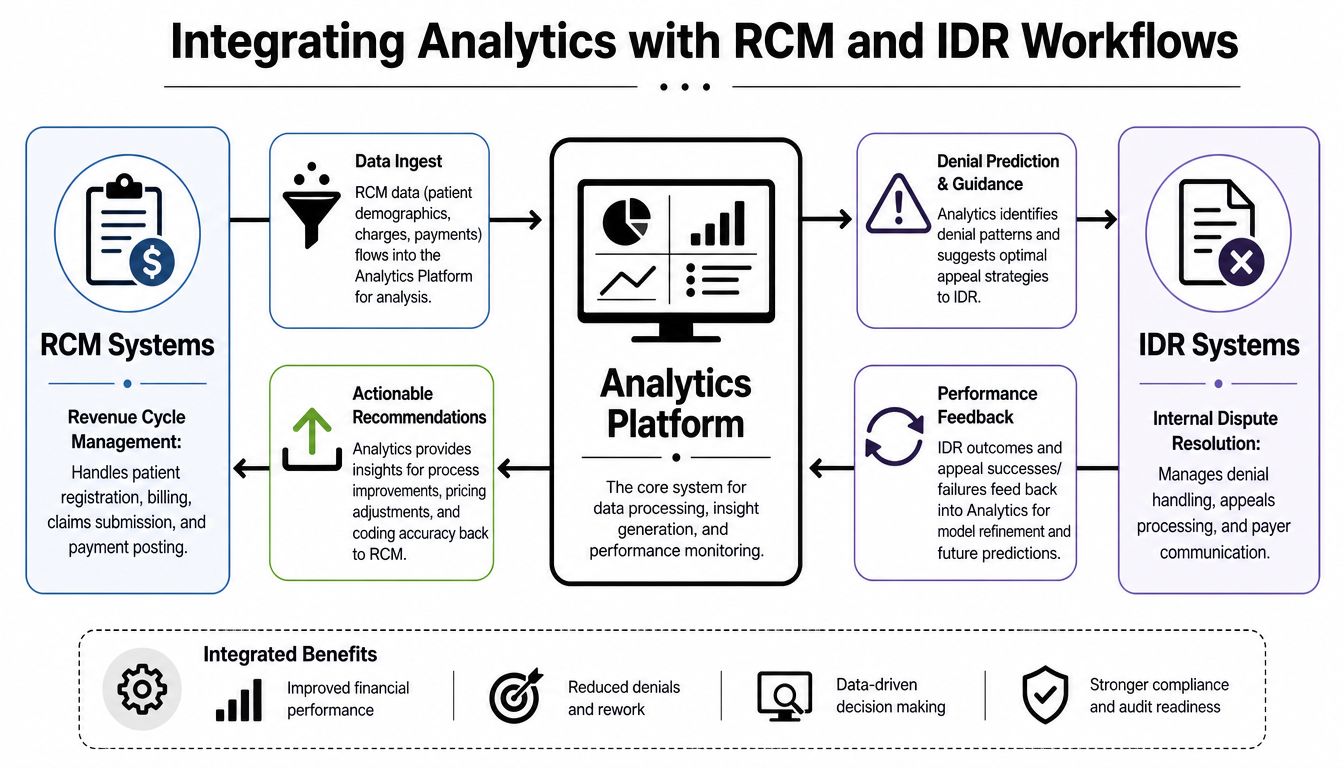
A standalone analytics tool usually fails for the same reason a standalone denial team fails. It sits outside the workflow where payment is won or lost.
That's one reason adoption disappoints. A 2023 industry analysis referenced in this review of real-time analytics adoption found that only 32% of hospitals using real-time analytics verified a statistically significant drop in denial rates within six months. The same analysis notes that some complex specialties, including air ambulance services, face denial rates up to 45%. The lesson isn't that analytics doesn't work. It's that visibility without workflow integration doesn't hold.
What upstream integration should do
When analytics connects directly to revenue cycle operations, it should influence claim construction before submission.
That means feeding intelligence into:
- Eligibility review so staff catch payer-specific coverage conflicts early
- Authorization workflow so required data elements aren't lost between intake and billing
- Coding review so high-risk modifiers, procedure combinations, and documentation dependencies are checked before claim release
- Work queue prioritization so staff don't treat all edits and denials as equally urgent
A disconnected dashboard may tell leadership that denials for a service line are increasing. An integrated system tells the billing team which claims to hold, what to correct, and which payer rule is driving the risk.
Why downstream IDR needs the same data spine
For specialties affected by the No Surprises Act, analytics also has to support dispute strategy. That's where many organizations break the chain. They have an RCM system upstream and a separate appeal or arbitration process downstream, but no shared evidence model between them.
That gap is costly. If your team can't connect payer behavior to claim attributes over time, it becomes much harder to show that underpayment isn't random. IDR preparation needs organized data on reimbursement patterns, code-level disputes, documentation consistency, and payer response behavior.
A stronger model links analytics directly to healthcare denial management and dispute handling so the same claim intelligence informs both pre-bill edits and post-payment escalation. One example in the market is RevGuard, which combines specialty-specific RCM with NSA-focused IDR workflows and an analytics layer designed to carry payer-behavior intelligence across the full reimbursement lifecycle.
The highest-value analytics platforms don't stop at "flagged claim." They help teams build cleaner claims and stronger disputes from the same underlying data.
The feedback loop that generic tools miss
The most important design principle is bidirectional learning.
If an IDR team wins disputes because a payer repeatedly underpaid a defined code set with consistent documentation support, that insight shouldn't stay in legal or appeals folders. It should flow back to claim-edit logic, payer routing rules, and management reporting. Likewise, if front-end analytics shows a recurring authorization defect, that intelligence should shape which denied claims are worth escalating later.
When organizations build that loop, analytics stops being descriptive and starts becoming operational.
Analytics in Action Specialty and Payer Use Cases
Theory is easy to agree with. The harder question is what healthcare revenue cycle analytics looks like when a specialty group uses it to change payer outcomes.
The difference usually starts with granularity. A broad dashboard says reimbursement is unstable. A targeted analytics model says one payer is denying one service pattern for one recurring reason, and here's how to fix the claim flow and build the dispute file.

Air ambulance and repeated medical necessity denials
Air ambulance providers live in one of the most difficult reimbursement environments in healthcare. Claims are high-dollar, fact patterns are acute, documentation standards are heavily scrutinized, and payer review behavior can vary sharply even when transport circumstances are similar.
In a practical operating model, the analytics team doesn't start with overall denial rate. It starts by sorting denied claims by payer, denial rationale, transport profile, dispatch context, and clinical documentation pattern. If one national payer repeatedly applies a medical necessity denial on a narrow set of claims, the provider can isolate whether the issue stems from inconsistent records, missing supporting elements, or adjudication behavior that looks patterned rather than claim-specific.
That changes the response. Instead of writing bespoke appeals one by one, the provider can create a repeatable evidence framework for a batch of related disputes. Upstream, intake and clinical documentation teams tighten the capture of the facts that are most often challenged. Downstream, the dispute file becomes more disciplined because it now includes a documented history of recurring payer treatment across similar claims.
Orthopedics and quiet downcoding
Orthopedic practices often face a different problem. The claim isn't denied outright. It's paid, but not correctly.
Generic dashboards underperform badly. They register cash, close the claim, and move on. A specialty-aware analytics model compares expected reimbursement behavior against actual payment at the procedure level, often revealing that a payer is repeatedly downcoding a complex service or reducing payment when specific documentation elements are absent or inconsistently abstracted into the claim.
For an orthopedic group, the operational fix may involve several small changes rather than one major overhaul:
- Pre-authorization alignment between scheduling and clinical staff so the authorized service description matches the billed reality
- Operative note review focused on the documentation details that support coding at the higher-complexity level
- Payment variance monitoring by payer and code family so underpayments are surfaced quickly, not at quarter-end
- Appeal packaging standards that use the same documentation logic every time a repeated reduction appears
What successful teams usually have in common
A review of analytics-driven RCM improvement from Qualify Health reports that analytics-based approaches can increase net revenue by 3–5%, reduce denials by up to 65%, and reduce days in accounts receivable by 15–20%. Those results don't come from prettier dashboards. They come from using analytics to alter daily workflow.
The teams that get traction usually do three things well:
- They engineer cleaner claims upstream. Denial prevention starts before submission, not after remittance.
- They monitor payer behavior at specialty depth. Code-level and scenario-level variance matters more than broad payer scorecards.
- They connect recovery to prevention. Every successful appeal or dispute should improve the next claim, not just resolve the last one.
In complex specialties, the financial win isn't simply faster reporting. It's creating claims that are both clean on the front end and dispute-ready on the back end.
When that discipline is in place, analytics becomes less of a business intelligence exercise and more of a reimbursement control system.
Implementing Analytics for Measurable ROI
A small lift in payment accuracy can outperform a much larger investment in reporting tools. I have seen specialty groups spend heavily on analytics, then miss the return because the build never reached the claim edits, payer variance rules, and dispute triggers that control reimbursement.
The fastest way to waste money on analytics is to buy software before defining the failure points. Specialty practices need a leakage map first. Identify where margin is lost across the full revenue path: eligibility, authorization, charge capture, coding, adjudication, underpayment detection, or IDR follow-through. An anesthesia group may find the underlying issue is not denial volume, but repeated downcoding tied to time-unit documentation gaps. An air ambulance provider may find the larger exposure sits after payment, where plan reductions are accepted without a structured NSA dispute path.
Start with the use cases, not the platform
A practical rollout starts with a short list of decisions the team needs to make every day.
Examples include:
- Which payer behaviors create the most underpayment exposure
- Which service lines have recurring first-pass failure
- Which denial categories should be prevented upstream versus escalated downstream
- Which claims need dispute-ready documentation at the time of submission
Those choices shape the data model, user permissions, work queues, and KPI definitions. Generic dashboards usually stop at visibility. Specialty analytics has to do more. It should connect front-end claim design with back-end recovery strategy so the same intelligence that flags a recurring reduction also changes how the next claim is built.
Questions worth asking vendors
Vendor evaluations should stay close to workflow.
- Can the system unify EHR, scheduling, billing, and payment data in one view?
- Can it segment by payer, CPT family, modifier, place of service, and specialty?
- Can staff move from a flagged trend to a claim-level work queue?
- Can appeal and dispute outcomes flow back into future claim rules?
- Can the platform support both operational users and executives without forcing two separate reporting environments?
Ask one more question that gets overlooked: can the system support your reimbursement model when federal IDR is part of the recovery path? If a platform can show underpayments but cannot tie them to qualifying payment amount logic, notice timelines, documentation standards, and dispute outcomes, it leaves money stranded. For specialties affected by the No Surprises Act, that gap is expensive.
Implementation ownership also matters. A capable platform still underperforms when billing, coding, and legal or dispute teams use different definitions for expected payment, denial categories, and escalation thresholds.
How to measure return without guessing
ROI should be measured against defined leakage categories, not broad promises about visibility.
A sound measurement plan tracks:
- Recovered revenue from underpayments and overturned denials
- Prevented leakage from cleaner claim submission and earlier defect detection
- Operational efficiency from less manual reconciliation and fewer low-value touches
- Cash acceleration from better A/R prioritization and faster escalation of collectible claims
Set baselines before launch. Review them monthly. Tie each gain to a process change.
That last step separates reporting from control. If a payer repeatedly under-reimburses a code family and the team wins those dollars back through appeal or IDR, the ultimate return comes when analytics pushes that finding upstream into documentation prompts, modifier rules, expected-payment logic, and escalation criteria. The strongest implementations create a closed loop. Every underpayment found downstream improves the next clean claim submitted upstream, which is how specialty groups stop recurring loss instead of funding a better view of it.
If your organization needs a tighter link between specialty-specific RCM and NSA-compliant dispute execution, RevGuard is one option to evaluate. The firm works across the full revenue lifecycle, combining claim engineering, payer-behavior analytics, and IDR workflows for specialties where generic dashboards often miss the actual source of underpayment.