

A 15% initial denial rate for commercial inpatient and outpatient claims is already enough to make denial management a finance problem, not a billing cleanup exercise. An analysis of more than 1,800 hospitals and 200,000 physicians found that one in three commercial inpatient claims remained unpaid for more than three months, and hospitals ultimately failed to receive, or later had recouped, about 8 cents of every dollar billed to commercial insurers. The American Hospital Association summarizes the analysis here.
The answer isn't to build a larger appeals department and celebrate every overturned claim. Strong hospital denials management best practices prevent avoidable errors before submission, route disputes to people with the right expertise, measure the cost of delay, and use payer behavior to improve the next claim. A high overturn rate can indicate excellent clinical advocacy, but it can also expose weak eligibility, authorization, documentation, or coding controls upstream.
What Denials Actually Cost Hospitals in 2026
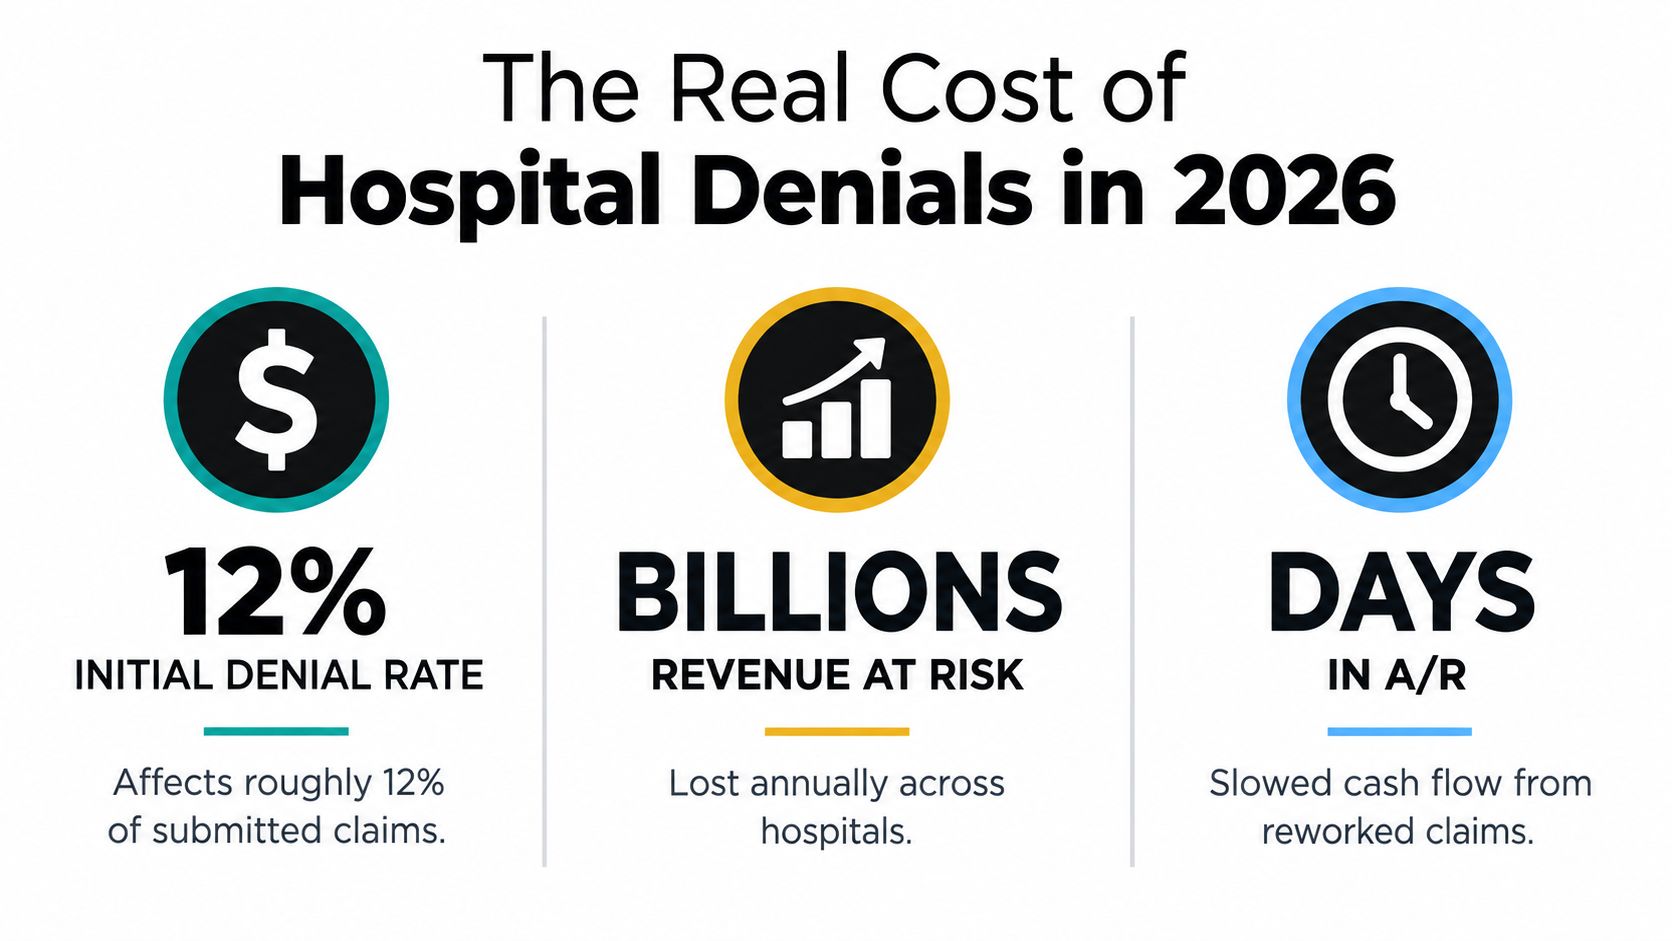
Commercial insurers create a different operating burden from traditional Medicare. Their initial denials were more than four times higher, and delayed payments were nearly three times higher in the cited hospital analysis. That comparison matters because a single denial rate across all payers can hide where cash, staff time, and follow-up capacity are being consumed.
Denials consume more than reimbursement. They consume working capital, staff capacity, clinical attention, and forecasting confidence. A claim that eventually pays after correction or appeal still requires additional touches, delays cash, and creates exposure to partial payment or timely filing failure.
Translate denials into financial decisions
CFOs should reject denial reports that show volume without financial context. Require four views:
- How much cash is delayed: Measure the time from initial submission to final payment, not only the date an appeal closes.
- How much labor is consumed: Track appeal touches, clinical review time, coding rework, and payer follow-up.
- How much value is exposed: Segment open accounts by dollars at risk and likelihood of recovery.
- Where leakage begins: Separate registration, eligibility, authorization, coding, documentation, medical necessity, and contract-payment issues.
The payer comparison should guide resource allocation. Commercial claims warrant tighter controls and closer operational review than a blended denial dashboard suggests. Traditional Medicare performed materially better in the verified analysis, but the source does not provide a standalone traditional Medicare percentage. Do not create a benchmark that the analysis does not support.
| Payer category | Initial denial rate | Delayed-payment rate | Revenue impact |
|---|---|---|---|
| Commercial insurers | More than four times higher than traditional Medicare | Nearly three times higher than traditional Medicare | Greater documented payment pressure |
| Traditional Medicare | More than four times lower than commercial initial denials | Nearly three times lower than the commercial delayed-payment rate | Lower documented payment pressure than commercial insurers |
A high overturn rate is not automatically evidence of a strong denial program. It may show skilled appeal work, but it can also expose weak upstream controls. The better question is why the claim required intervention and whether the next submission can be designed to avoid the same failure.
Treat denials as recurring revenue leakage with identifiable causes, then assign improvement work to the process that created each cause. Hospitals seeking a broader explanation can review this overview of revenue leakage in healthcare. Payer results should inform claim design and prevention priorities, not serve only as a collections scoreboard.
Upstream Controls That Prevent Most Denials
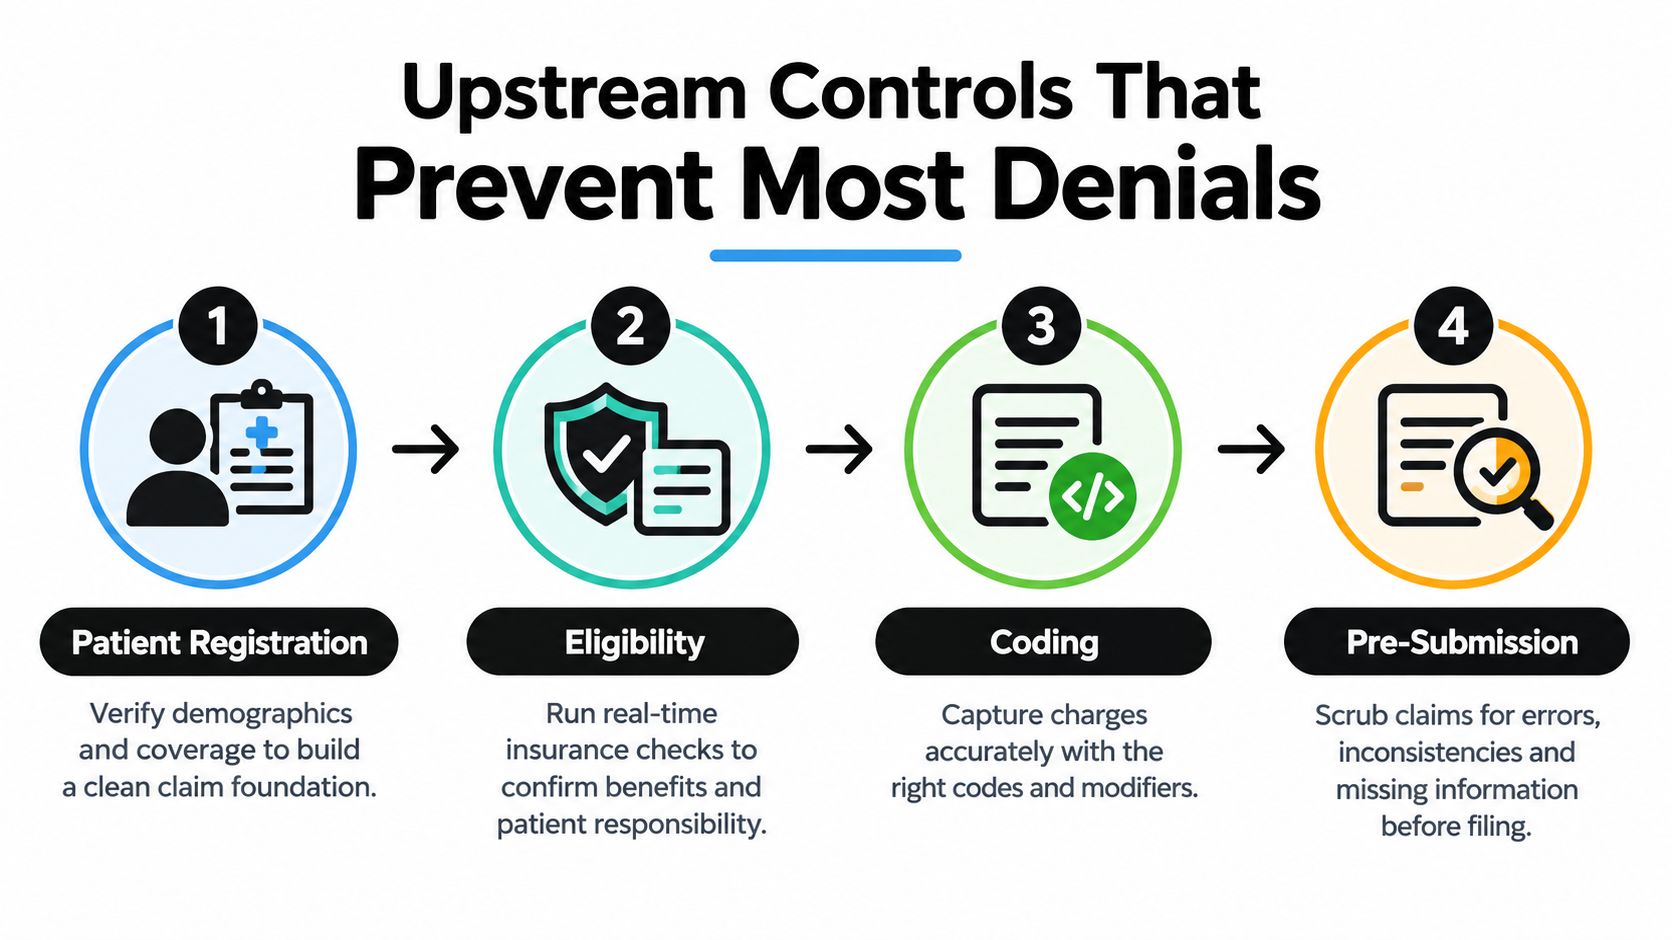
A claim should be built to survive payer review before it reaches billing. Prevention begins when a service is scheduled or ordered, not when an analyst opens a denial letter.
Patient access owns the first control point. Registration staff should verify demographics, coverage, coordination of benefits, and the payer attached to the encounter. Perform eligibility checks early enough to correct discrepancies before service, then repeat them when coverage or the planned service changes. A reliable medical eligibility verification process creates documented evidence for the claim instead of relying on a green status indicator.
Build a dispute-ready claim
Prior authorization is the next checkpoint. Confirm whether authorization is required, record the approval number and scope, and reconcile both with the service delivered. Approval for one procedure, location, provider, or level of care does not protect a materially different claim.
Clinical documentation and coding must tell one consistent story. Physicians, utilization review teams, clinical documentation integrity specialists, and coders should resolve gaps before billing. The record should support the level of care, medical necessity, services performed, and selected codes. Configure payer-specific edits to catch known conflicts without placing broad holds on clean claims.
Separate prevention paths by root cause
Assign each defect to the process that created it. Demographic or eligibility errors require a registration fix. Missing authorization belongs with scheduling or utilization management. Medical-necessity denials call for clinical evidence and, often, physician involvement. Coding disputes may require code review, documentation clarification, or payer-specific education.
Use pre-submission scrubbing to test:
- Patient and payer data: Names, identifiers, coverage, coordination of benefits, and billing provider details.
- Authorization evidence: Approval status, scope, dates, units, location, and rendering provider.
- Clinical support: Level of care, medical necessity, operative details, and required attachments.
- Coding integrity: Diagnosis and procedure alignment, modifiers, charge capture, and payer edits.
- Submission controls: Claim completeness, filing deadlines, attachments, and duplicate detection.
A 2023 Premier study cited by the AHA estimated that hospitals spent just under $20 billion annually appealing denials, with more than half reportedly tied to claims that should have been paid at initial submission, according to The AHA's summary of the study. That finding supports a clear priority: use appeal outcomes and IDR results to improve claim design, while treating a high overturn rate as evidence of upstream weakness, not proof of program excellence.
Centralized Denials Workflows and Ownership
A denial without a named owner is an unpaid account with a deadline. Hospitals often distribute denials across patient access, coding, utilization review, billing, and service-line teams, then discover that everyone can describe the problem but nobody owns the result.
Centralization doesn't mean one person handles every denial. It means one operating model governs intake, classification, prioritization, escalation, reporting, and prevention. A central denials leader should own the inventory and service-level expectations, while specialized teams resolve claims according to the type of work required.

Put every denial in the right queue
A useful queue design combines several dimensions rather than relying on payer name alone:
| Queue dimension | Why it matters |
|---|---|
| Payer | Policies, contacts, edits, and escalation paths vary |
| Root cause | Prevention belongs to a different department for each cause |
| Service line | Clinical evidence and coding patterns differ by specialty |
| Preventability | Front-end defects require prevention, while legitimate disputes require advocacy |
| Dollars at risk | High-value accounts deserve proportional attention |
| Appeal status | Open, submitted, pending, partially paid, and closed claims need different actions |
Create denial tiers. Administrative denials can move through trained revenue-cycle staff with standardized correction and resubmission rules. Coding denials need coding expertise and documentation review. Clinical denials should reach utilization review, clinical documentation integrity, or a physician advisor. Contract underpayments belong with payment integrity and payer contracting teams, not a generic appeals queue.
Practical rule: If a queue can't show its owner, next action, deadline, and expected financial value, it isn't a workflow. It's a holding area.
The central team should also publish a root-cause taxonomy and require consistent denial reason coding. Payer reason codes alone won't explain why the claim failed inside the hospital. Add an internal cause, such as missed authorization update, incomplete clinical record, charge capture defect, or incorrect payer rule configuration.
Finally, hold a recurring prevention meeting with patient access, coding, clinical documentation, utilization review, billing, contracting, and finance. Review recurring causes, assign corrective actions, and close the loop by checking whether the same denial pattern returns. Centralization creates accountability, but cross-functional ownership removes the conditions that keep producing the inventory.
Appeals and Escalation That Win More Often
Treat every appeal as a resource-allocation decision before any writing starts. Check the evidence supporting payment, dollars at risk, payer reversal patterns, filing deadlines, and the staff or clinical time required. A denial with weak documentation should not consume the same effort as a defensible, high-value claim.
Use a tiered appeal path
First-level administrative review handles correctable defects. Include the claim, remittance detail, eligibility evidence, authorization record, corrected demographic information, and a concise explanation of the correction. Keep a simple administrative fix out of a long clinical narrative.
Clinical review or peer-to-peer escalation applies when the payer disputes medical necessity, level of care, or clinical justification. Assemble the relevant progress notes, orders, diagnostic findings, treatment history, discharge information, and applicable payer policy. The physician advisor should answer the payer's stated criteria directly. Submitting the entire chart without an argument shifts the review burden to the payer and weakens the case.
Second-level review fits a first response that ignores evidence, applies the wrong policy, or reaches an incomplete decision. Compare the denial language with the original appeal, identify the unanswered points, and state the requested resolution precisely.
External review or independent dispute pathways belong only on cases that meet applicable requirements and justify the administrative work. Compliance requirements, filing windows, documentation standards, and payer-specific rules should control the decision.
Prioritize by expected value
Rank the worklist using dollars at risk, overturn probability, clinical defensibility, filing deadline, and cost to work. A well-supported, high-value clinical denial may outrank a larger inventory of low-value administrative accounts. A claim approaching its deadline may require immediate action even when expected recovery is modest.
Every appeal package should answer five questions:
- What service was provided?
- Why was it covered and medically supported?
- Which payer rule or contract provision applies?
- What evidence proves compliance?
- What exact payment or correction is requested?
Track partial payments separately. A payer response that pays something is not automatically a successful resolution. Reconcile the expected allowed amount, contractual terms, codes, units, modifiers, and remaining balance. Underpayments can remain hidden in “settled” accounts, so send them into the same root-cause analysis as formal denials.
The Department of Health and Human Services Office of Inspector General found that 75% of examined Medicare Advantage care denials were overturned on appeal, a result that supports disciplined evidence review while setting up the KPI question of whether recovery measures reflect prevention, cash timing, and avoidable rework. The AHA's discussion of denial costs and appeals
The KPI Trap and What to Measure Instead
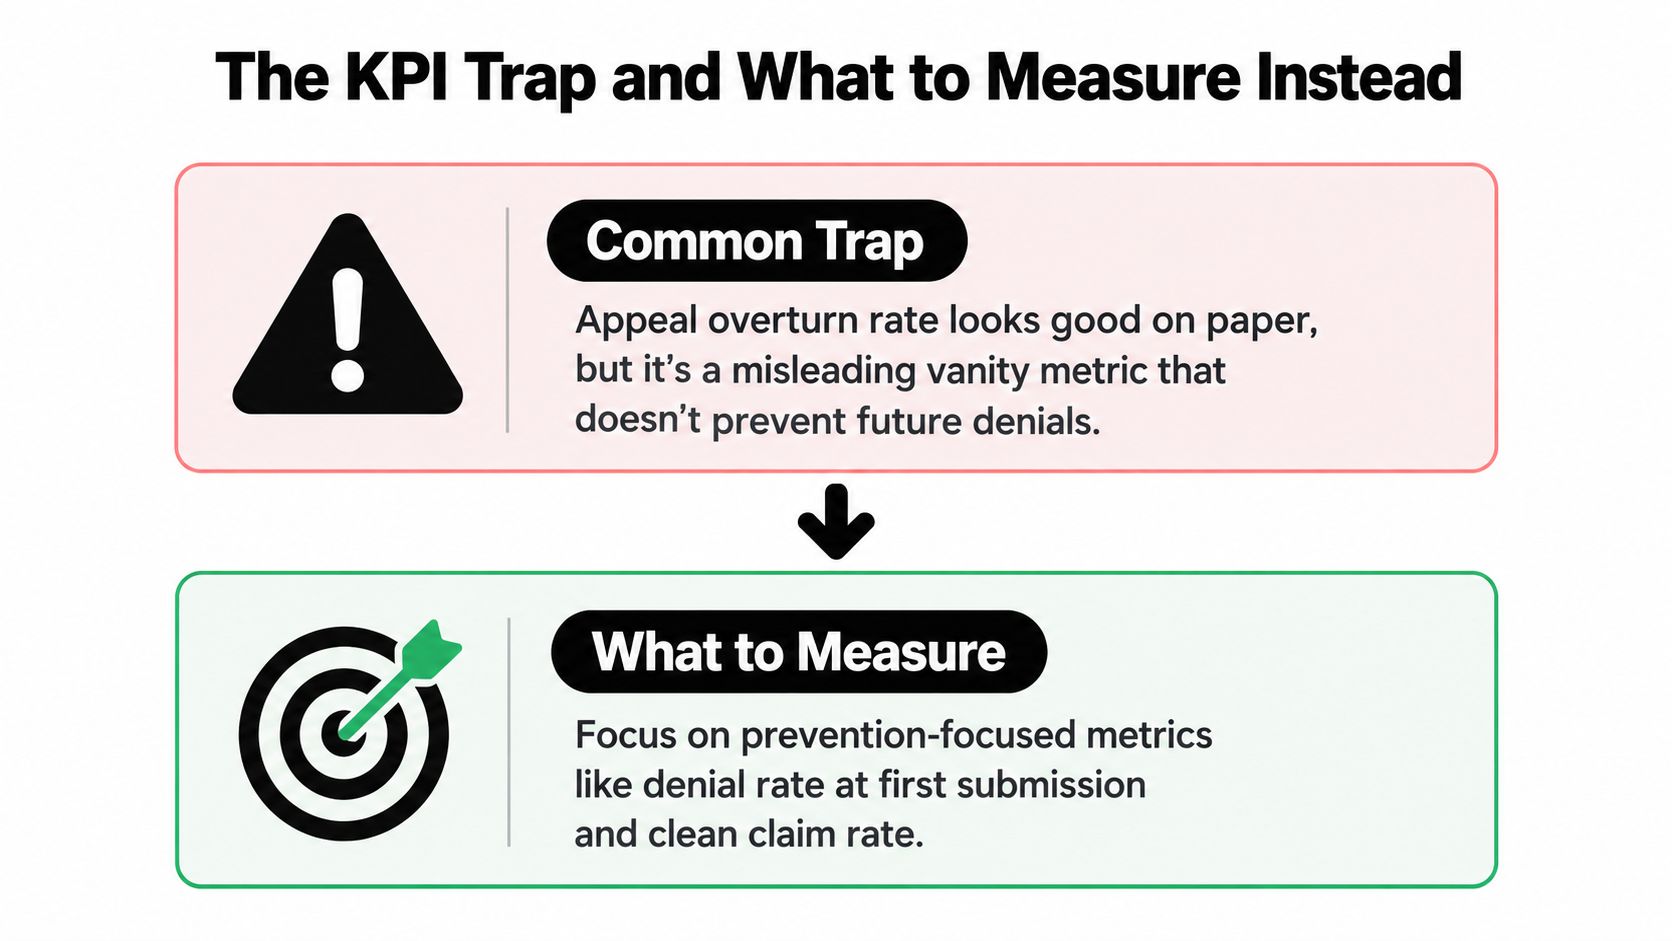
The appeal overturn rate is a vanity metric when viewed alone. It measures what happened after a denial, not whether the hospital should have prevented the denial or how long it took to receive the money.
Medicare Advantage provides the clearest warning. Plans denied approximately 17% of initial claim submissions, and 57% of those denials were later overturned. Hospitals reportedly spent nearly $18 billion overturning denials in 2025, while total spending on collecting insurer payments reached about $43 billion. The AHA's Cost of Caring data puts the operational burden in financial terms.
Replace celebration with diagnosis
A team can improve its overturn rate while worsening cash performance. It may appeal easy cases, leave difficult accounts untouched, or accept months of avoidable delay as the cost of recovery. That isn't denial excellence. It's expensive rework.
Use these measures instead:
- Initial denial rate: Shows what happens at first submission, segmented by payer, service line, and root cause.
- Preventable-denial rate: Identifies the share caused by internal controls that could have operated earlier.
- Days to payment after denial: Measures avoidable delay, not just whether an appeal eventually closed.
- Appeal touches: Shows labor intensity and exposes cases that require excessive manual work.
- Net dollars recovered per appeal: Subtract labor and other administrative costs from recovered value.
- Partial-payment loss: Identifies money still missing after an apparent resolution.
- Clean-claim rate: Shows whether the submission process is producing claims that can be adjudicated without rework.
A successful appeal isn't a clean result if the hospital spent clinical time, administrative labor, and months of cash flow to correct an avoidable submission failure.
The right dashboard connects each overturned denial to its origin. If eligibility errors produce repeated reversals, fix registration. If clinical denials are frequently overturned because documentation was present but not attached, fix claim construction. If a payer repeatedly downcodes a service, investigate contract language, coding logic, and payer behavior together.
Reward prevention and net recovery, not raw appeal volume. Otherwise, the organization teaches staff that creating recoverable denials is almost as valuable as preventing them.
KPI Governance, Dashboards, and Service-Line Accountability
A dashboard changes nothing unless it triggers a decision. Put every metric in a governance loop with a defined audience, review cadence, threshold, and accountable owner.
The daily operational view should help managers act on open work. Show denial inventory by queue, upcoming filing deadlines, high-value accounts, unresolved clinical reviews, pending payer responses, and claims approaching escalation. Keep the view close to the people who can assign work or remove a blockage.
The monthly executive view should answer different questions. Show initial denial rate, preventable-denial rate, days to payment, net recovered dollars, administrative cost per recovered dollar, recurring payer issues, and service-line trends. Finance leaders need the effect on cash and cost to collect. Clinical leaders need documentation and medical-necessity patterns. Payer contracting leaders need evidence of structural underpayment or policy friction.
Turn metrics into triggers
| Metric | Decision trigger | Named owner |
|---|---|---|
| Eligibility denial trend | Review registration workflow and verification evidence | Patient access leader |
| Authorization denial trend | Audit scheduling, utilization review, and authorization matching | Utilization management leader |
| Clinical denial trend | Convene physician advisor and documentation review | Chief medical or physician advisor function |
| Coding denial trend | Audit code selection, modifiers, and documentation alignment | Coding leader |
| Delayed payment | Escalate payer follow-up and prioritize cash exposure | Denials operations leader |
| Repeated underpayment | Review contract terms, claim construction, and payer behavior | Contracting and payment integrity |
Use a healthcare analytics dashboard that allows teams to move from payer trend to individual account and then back to the upstream process. A high-level denial category isn't actionable until someone can identify the service line, workflow step, payer rule, and staff owner connected to it.
Each service line should own its preventable causes, while the central denials team owns inventory discipline and appeal execution. Review corrective actions until the cause changes, not merely until the meeting produces a presentation. When a payer changes an edit or a service line changes its documentation workflow, record the change and monitor the downstream result.
The strongest governance model treats denial data as operational intelligence. It tells leaders which claims to redesign, which payer conversations to escalate, and where clinical teams need clearer documentation standards.
No Surprises Act IDR as a Feedback Loop, Not a Hammer
Independent Dispute Resolution under the No Surprises Act belongs inside the revenue strategy, but it shouldn't become a default collections button. It can be relevant for recurring disputes involving emergency services, air ambulance, anesthesia, and other facility-based specialties, particularly where payer negotiations and payment differences persist.
The mistake is to judge IDR only by cases won. A favorable determination may recover a disputed payment, but it doesn't explain why the claim reached arbitration, whether the qualifying-payment amount was reasonable, or what evidence would have produced a better pre-arbitration result.
Connect every dispute to claim design
For each dispute, capture:
- Authorization status and applicable coverage information.
- Original coding, modifiers, documentation, and service complexity.
- Geographic and facility context.
- Qualifying-payment amount.
- Negotiation history and settlement threshold.
- Evidence submitted and final determination.
- Cost, time, and staff effort required.
CMS began publishing federal IDR public-use data for 2025 Q3 and Q4 with the certified IDR entity included on each dispute line item. CMS's federal IDR reports create an opportunity to study variation across certified entities and dispute characteristics.
That data should inform compliant internal analysis, not encourage arbitrator shopping or assumptions that one favorable result predicts another. Compare outcomes by specialty, payer, dispute characteristics, evidence package, qualifying-payment amount, and negotiation history. Use the findings to refine settlement thresholds and documentation standards, while keeping legal and regulatory review in the process.
Feed outcomes upstream
If a recurring underpayment follows weak authorization evidence, fix the authorization workflow. If downcoding appears across a specialty, review coding logic, documentation, contract terms, and payer edits. If disputes cluster around a specific service configuration, build a more complete claim package before submission.
IDR also belongs in contracting discussions. A pattern of repeated disputes can show that the organization's reimbursement assumptions, payer communications, credentialing records, or claim construction need attention. The aim is fewer future disputes and stronger first-pass claims, not a larger arbitration inventory.
Use IDR when the dispute is eligible, defensible, financially justified, and supported by a compliant process. Don't use it to compensate for missing upstream controls.
A 90-Day Roadmap to Put the Framework in Place
A hospital or specialty group can establish the operating model in three phases. Start with the constraint that hurts most: preventable denials, slow resolution, or recurring underpayment.
Days 1 through 30
Inventory the denial population and standardize the internal root-cause taxonomy. Segment by payer, service line, cause, preventability, appeal status, and dollars at risk. Bring patient access, utilization review, clinical documentation, coding, billing, finance, contracting, and compliance into the same working session.
Deliverables should include a prioritized denial map, named owners, filing-deadline controls, and a short list of upstream defects to correct first. Don't wait for perfect data. Create a usable baseline and improve it as teams classify accounts consistently.
Days 31 through 60
Stand up the centralized work queues and assign denial tiers. Define which cases receive administrative correction, coding review, clinical escalation, second-level appeal, or external review. Replace raw overturn reporting with initial denial rate, preventable-denial rate, days to payment, appeal touches, and net recovered dollars.
Give managers a daily worklist and executives a monthly view. Every metric needs a person, a meeting, and an action threshold.
Days 61 through 90
Connect denial outcomes to service-line corrective actions and payer strategy. For recurring underpayments and eligible disputes, establish an IDR review process that captures claim design, evidence, negotiation history, and final outcome. Use the available CMS public-use data as contextual intelligence, while preserving compliance review.
At the end of the first quarter, leadership should be able to identify which denials were preventable, which appeals created net value, where payment was delayed, and which payer patterns require contracting or claim-design action. That is the operating standard for hospital denials management best practices.
RevGuard combines specialty-focused revenue cycle management with denial tracking, payer-behavior intelligence, appeals workflows, and No Surprises Act IDR support. If your hospital or provider platform needs to connect clean-claim controls with downstream recovery and transparent KPI reporting, visit RevGuard to discuss the workflow.