

Days in AR equals Accounts Receivable divided by Average Daily Credit Revenue. For example, $1,200,000 in net AR divided by $25,000 in daily revenue produces 48 days.
That calculation looks simple on a revenue-cycle report. In practice, the number can be badly misleading when the practice mixes gross charges with net receivables, uses a single volatile month, or changes the denominator without documenting it. A specialty practice may see AR days rise because case volume fell temporarily, not because collectors stopped working. Another may report a low result by dividing net AR by gross charges that will never be collected.
The useful question isn't only, “What are our days in AR?” It's, “What exactly did we measure, and does the result reflect collection performance?” The formula matters, but the accounting basis, time window, payer mix, and aging profile matter just as much.
The Core Formula for Days in Accounts Receivable
The standard equation is:
Days in AR = Accounts Receivable ÷ Average Daily Credit Revenue
Average daily credit revenue is calculated by dividing credit sales or patient-service revenue for a consistent measurement period by the number of days in that period. For annual reporting, the equation becomes:
Days in AR = Net AR ÷ (Annual Credit Revenue ÷ 365)
Using a shorter period follows the same logic. If a specialty practice has $1,200,000 in net AR and $9,125,000 in annual credit revenue, annual revenue produces $25,000 in average daily revenue, and the result is 48 days. The calculation follows the broader accounting treatment described in this days sales outstanding formula guide.

A simple calculation workflow
- Pull the receivables balance. Use the AR balance tied to the same reporting date as the calculation.
- Choose the revenue basis. Decide whether the denominator will use net patient-service revenue or another clearly defined credit-revenue measure.
- Choose the period. Use annual revenue divided by 365, or a shorter matching window such as a trailing 90-day period.
- Divide AR by average daily revenue. The result expresses receivables as an equivalent number of revenue days.
A shorter example makes the relationship easier to see. If trailing-90-day charges total $2,700,000, average daily charges are $30,000. With $1,050,000 in AR, the calculation produces 35 days. The period and revenue basis must remain consistent when you compare this result with future reports.
Practical rule: A change in days in AR isn't meaningful until you confirm that both the numerator and denominator were built on the same basis.
This baseline catches many reporting errors. If a report divides AR by monthly revenue but labels the result as annualized days, or uses net AR against gross charges, the output may look precise while measuring something else. Practices that track the equation, measurement date, revenue basis, and time window in their revenue cycle management metrics can identify those changes before managers act on a false trend.
Setting Up the Numerator and Denominator Correctly
The numerator should be net patient receivables from the balance sheet, not an unfiltered total pulled from a practice-management system. Remove credit balances, contractual allowances, charity-care discounts, and estimated uncollectible amounts before using the figure. These adjustments determine how much of the reported balance represents receivables the practice expects to collect.
The denominator should use net patient-service revenue over the same measurement period. A common operational choice is the most recent three months, provided the practice uses that window consistently. The technical guidance from HFMA's MAP Keys emphasizes matching net AR with net revenue rather than pairing net AR with gross charges.
Build the numerator first
Start with the balance-sheet AR report for the measurement date. Then document what the balance includes and excludes.
- Include collectible net patient receivables: Use balances after relevant contractual and collectibility adjustments.
- Exclude credit balances: A credit owed to a patient or payer isn't an unpaid receivable.
- Exclude contractual allowances: These amounts won't be collected as patient or payer cash.
- Exclude charity-care discounts and estimated uncollectibles: They don't represent expected collectible revenue.
This control is especially important in specialties with substantial payer adjustments. A gross charge ledger can be several times higher than the amount the practice expects to receive. Feeding that gross figure into the numerator overstates the balance and makes AR days look worse than the underlying collectible position.
Match the revenue basis
Suppose a specialty practice reports $900,000 in net AR and $2,700,000 in net patient-service revenue over a matching 90-day period. Average daily net revenue is $30,000, producing 30 days. The example is valid because both sides use a net basis and the measurement periods match.
The distortion appears when the practice divides that same net AR by gross charges. The denominator becomes larger than the collectible revenue base, which pushes the reported days downward and can make performance appear artificially efficient. The reverse mismatch, gross AR divided by net revenue, can inflate the result.
The report should therefore state whether AR is net of credits and allowances, whether revenue is gross or net, and which dates define the period. Without those fields, two practices can report different days in AR while both claim to use the “standard” formula.
Handling Volatility with Trailing Periods and Aging Buckets
A single month can produce a noisy denominator. An anesthesia group may have fewer cases during a temporary lull, while an emergency-services provider may experience abrupt volume changes. If AR remains relatively stable while charges fall, average daily revenue shrinks and calculated days in AR rises, even when the billing team hasn't become less effective.
A trailing 90-day denominator reduces that distortion by incorporating a broader operating window. Calculate total charges or net revenue for the trailing period, divide by 90, and then divide total AR by the resulting average daily amount. The trailing-period and aging guidance also recommends reconciling the result to defined aging buckets.
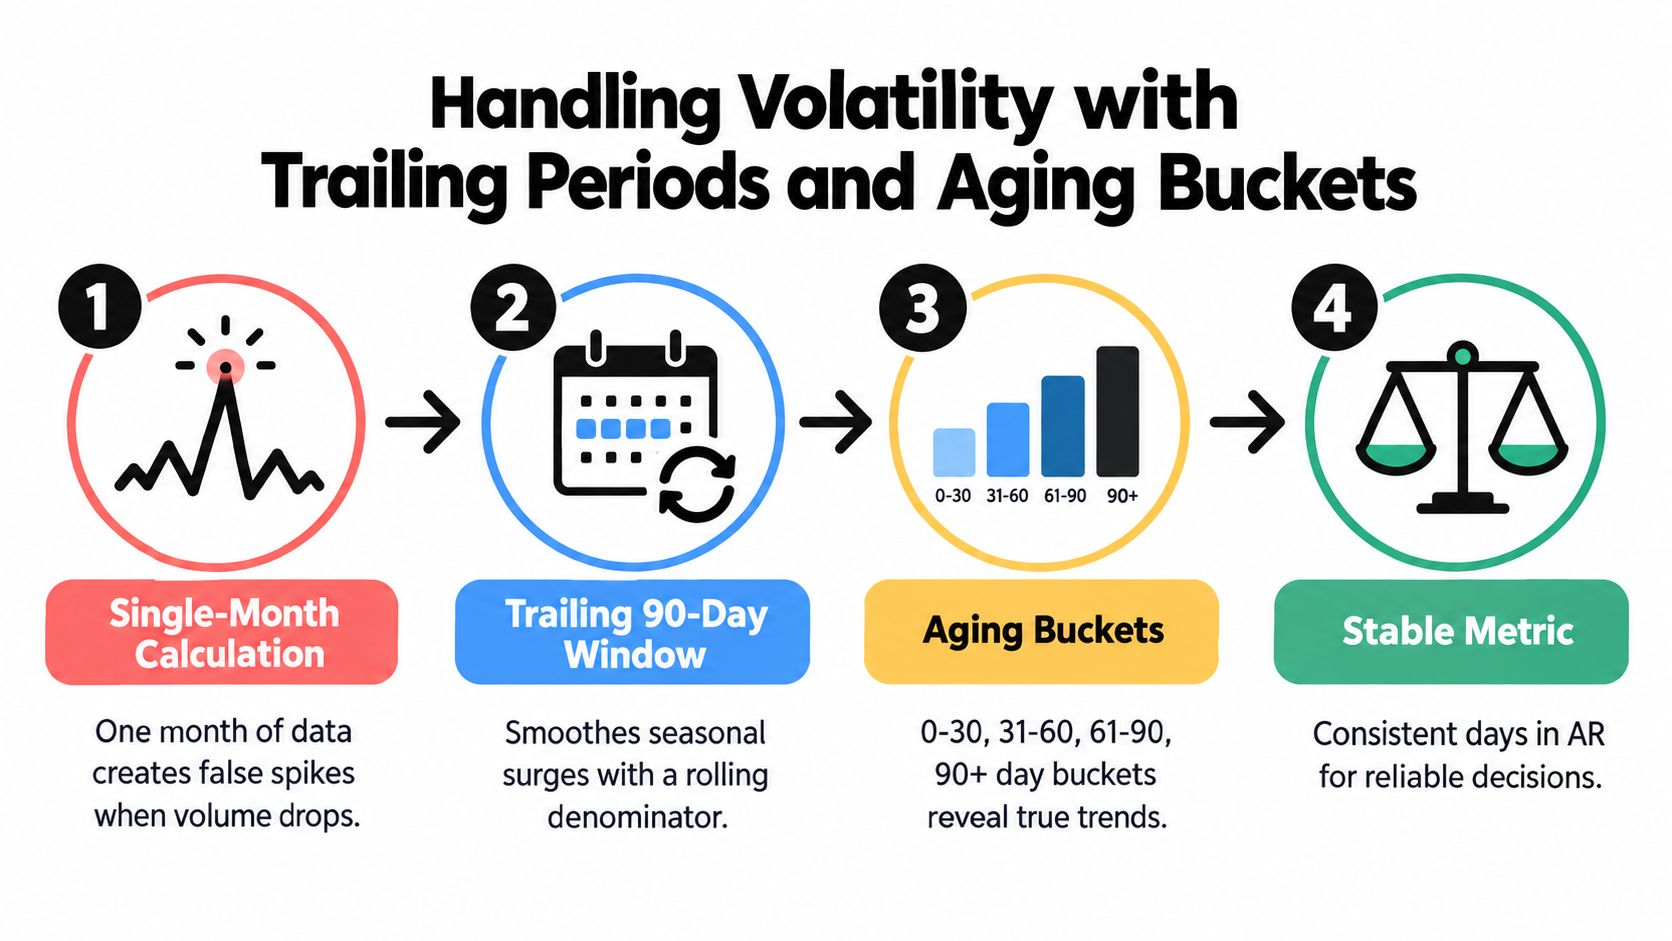
Smooth the denominator, then inspect the balance
For example, $18 million in 90-day gross charges produces $200,000 in average daily charges. With $2.5 million in AR, the result is 12.5 AR days. That is a gross-charge calculation and shouldn't be benchmarked directly against a net-AR calculation.
The rolling window improves trend interpretation, but it doesn't fix a flawed revenue basis. A practice must label the result as gross-charge or net-revenue days and compare it only with results calculated the same way.
Then reconcile the headline figure against an aging schedule:
- 0–30 days: Recent balances that may still be moving through normal payer processing.
- 31–60 days: Accounts requiring closer follow-up by payer and claim status.
- 61–90 days: Balances where unresolved edits, denials, or missing documentation need attention.
- 91–120 days: Older claims that may face appeal or timely-filing pressure.
- Over 120 days: Aged balances requiring targeted recovery, adjustment review, or escalation.
A practice can show an acceptable total while carrying a damaging concentration in old AR. For instance, $2 million in total AR with $300,000 older than 90 days means 15% aged AR, exceeding the 10% control point cited in healthcare KPI guidance, even if the overall days figure appears reasonable. That is why the AR aging report belongs beside the days-in-AR trend, not in a separate monthly folder.
Denial rework can add roughly 30–90 days to affected claims and inflate aggregate AR days when teams don't isolate denied balances. The dashboard should show whether a rising result comes from current claims flowing normally or old denied claims remaining untouched.
Benchmarking Your Result Against Industry Standards
A days-in-AR result has meaning only in context. Healthcare organizations commonly use an approximate 30–40-day healthy range, while median physician-practice reporting identifies a result near 47 days and better-performing practices closer to 36 days, as summarized in this healthcare days-in-AR benchmark discussion.
Those figures are useful reference points, not automatic pass-or-fail rules. A practice at 36 days is collecting materially faster than one at 47 days, assuming both use the same formula, revenue basis, payer mix, and aging definitions. A result above 50 days generally warrants investigation, but the number doesn't identify the cause by itself.
Use benchmarks as a diagnostic screen
A practical interpretation looks like this:
| Result | What it may indicate | What to inspect |
|---|---|---|
| Around 30–40 days | A commonly cited healthy operating range | Aging distribution, payer mix, and consistency of the calculation |
| Near 47 days | A result aligned with median physician-practice reporting | Submission delays, denials, underpayments, and patient balances |
| Near 36 days | A stronger collection pace in the cited benchmark context | Whether the practice uses the same net or gross convention |
| Above 50 days | A signal that investigation is appropriate | Claim status, coding, eligibility, denials, payer response, and old AR |
Specialty context changes the interpretation. Emergency services and air ambulance organizations can experience volatile case volume, unusual payer timing, and complex reimbursement pathways. Their leaders shouldn't launch a sweeping operational change because one month moved above a benchmark. They should first test whether the denominator changed, whether payer composition shifted, and whether the aging profile deteriorated.
The opposite mistake is complacency. A practice may sit within a familiar range while old balances accumulate underneath the total. Keep the share of total AR older than 90 days below 10% as a practical control point, then segment that balance by payer, specialty, denial reason, and patient responsibility.
A benchmark tells you where to look. It doesn't tell you what to fix.
Compare your organization with itself over time whenever possible. External comparisons are most useful when the other organization uses a comparable formula and operates with a similar specialty, payer mix, emergency-service profile, and contractual timing.
Common Pitfalls That Distort Your AR Calculation
The most dangerous AR reports aren't obviously wrong. They contain valid-looking numbers assembled from incompatible sources. A manager sees a clean trend line, but the calculation changed from net revenue to gross charges or from an annual denominator to a single month.
The first failure is denominator inconsistency. One month uses trailing 90-day revenue, the next uses current-month charges, and the report presents both as comparable. That change can create a false improvement or deterioration without any underlying shift in collections.
Four errors that deserve a control
- Mixing net AR with gross charges: The large gross denominator can make days appear artificially low because it includes revenue the practice won't collect.
- Mixing gross AR with net revenue: This can make days appear artificially high by including balances that should have been removed through allowances or collectibility adjustments.
- Ignoring case-volume swings: A temporary decline in charges can increase calculated days even when claims are being paid and follow-up is working.
- Using days in AR alone: The headline metric can hide old denials, patient balances, or payer-specific delays that an aging report would expose.
The denominator problem is especially visible in anesthesia and emergency services. A temporary reduction in charges lowers average daily revenue. If the AR balance doesn't fall at the same pace, reported days rise. That doesn't prove collection performance deteriorated, and changing collector assignments immediately may address the wrong problem.
Test the number before changing operations
Ask four questions before escalating:
- Did the numerator definition change? Check credits, contractual allowances, charity-care discounts, and estimated uncollectibles.
- Did the denominator period change? Confirm whether the report uses annual data, a single month, or a trailing 90-day window.
- Did the revenue basis change? Identify gross charges, net charges, or net patient-service revenue.
- Did the aging profile change? Review the balance across each bucket rather than relying on the total.
Cash collections provide a second reality check. If days rise while cash collections remain stable and the aging profile is unchanged, denominator movement may explain the result. If days rise alongside growing older AR, unresolved denials, and weaker collections, the practice has a more substantive revenue-cycle problem. The denominator sensitivity analysis reinforces why reports should disclose the formula rather than present a universal number without context.
Tracking Days in AR Inside Modern RCM Workflows
Days in AR becomes useful when the revenue-cycle team can trace movement to specific work queues. A dashboard should show the formula type, measurement date, numerator composition, denominator period, gross-versus-net basis, payer mix, and separate insurer and patient AR. Without those fields, an apparent trend may reflect a reporting change.
Pair the metric with operational signals:
- Claim status: Identify submitted, pending, rejected, denied, appealed, and underpaid claims.
- Aging concentration: Show balances in each aging bucket and isolate AR older than 90 days.
- Payer behavior: Separate payer delays from patient-responsibility collection issues.
- Denial rework: Track whether affected claims are being corrected, appealed, or left idle.
- Cash movement: Compare AR days with actual collections and payment timing.
A daily dashboard doesn't mean leadership needs to react to every daily fluctuation. Use daily data for queue management, review the trend on a consistent cadence, and establish escalation rules for persistent movement. If days rise, the team should be able to identify whether the cause is a submission backlog, eligibility failure, coding issue, denial rework, payer underpayment, or patient collection delay.
For specialty practices handling complex payer disputes, an RCM workflow can also connect claim preparation with downstream escalation. RevGuard combines specialty-specific RCM with enforcement-driven Independent Dispute Resolution workflows and provides dashboards for payer behavior and revenue-cycle KPIs. Its healthcare revenue cycle analytics can be considered alongside practice-management reports when teams need a more connected view of claims, denials, underpayments, and receivables.

Review the formula and aging profile on a consistent schedule, but assign work continuously. The metric should trigger investigation and prioritization, not sit in a spreadsheet until month-end.
If your days in AR report doesn't disclose its numerator, denominator, revenue basis, and aging profile, RevGuard can help connect those controls to specialty-specific RCM and payer-dispute workflows. Visit RevGuard to evaluate how a clearer dashboard and structured revenue protection process can help your team identify leakage before it becomes aged AR.