

More than 2.5 million No Surprises Act disputes were filed in 2025, compared with about 200,000 in 2022, according to reporting summarized by The Washington Times. That shift changes what medical billing metrics need to accomplish. They can't stop at claim submission, denial counts, and days in A/R. They must also show which payers underpay, how quickly teams recover disputed revenue, and whether arbitration produces an award that justifies the work.
A healthy revenue cycle leaves an evidence trail from eligibility and coding through payment posting, appeals, negotiation, and Independent Dispute Resolution. Without consistent definitions, a denial rate can look acceptable while dollar leakage, short pays, and delayed follow-up continue unchecked. The practical standard is simple: every metric should identify a financial risk, assign ownership, and trigger a specific action.
The Escalating Battle for Reimbursement
Federal regulators originally expected about 17,000 to 22,000 disputes per year, yet actual filings reached about 200,000 in 2022, 1.46 million in 2024, and 2.56 million in 2025. More than 3.3 million disputes were filed from mid-2022 through May 2025, based on the reported No Surprises Act arbitration data.
For a specialty practice, those volumes change the operating model. Consider an ASC reviewing three claim outcomes: one rejected because documentation or authorization is incomplete, one paid below the contracted or qualifying amount, and one sent to negotiation or IDR because the payer's position does not reflect the service, acuity, or market context. A single denial rate cannot distinguish these problems or show which one deserves staff time.
The metric stack has changed
Traditional RCM measures still provide the operating baseline. Initial denial rate, clean claim performance, days in A/R, net collection rate, and appeal resolution time show whether accurate claims become cash. High-volume arbitration adds a second layer of performance measures: dispute volume, provider win rate, award-to-QPA ratio, and recovery by payer and service line.
These KPIs connect reimbursement outcomes to workflow choices. A recurring underpayment may belong in routine follow-up, payer negotiation, contract review, or IDR. Filing every eligible dispute can increase recovery opportunities, yet it also consumes specialist capacity and may weaken case preparation when documentation is rushed.
Operational rule: A metric earns its place on the dashboard only when someone knows what decision it should change.
The strongest billing operations treat data as financial defense. They correct defects before submission, preserve documentation throughout the claim lifecycle, and organize payment variance data before a dispute becomes urgent. IDR does not replace disciplined RCM. It acts as a downstream enforcement mechanism for reimbursement problems that upstream controls failed to resolve.
Why Standardized Metrics Matter
A CFO, coding manager, and payer follow-up lead can all use the phrase “denial rate” while measuring different events. One may count clearinghouse rejections, another may count payer denials after adjudication, and a third may divide denial dollars by total charges. That inconsistency makes internal meetings argumentative instead of useful.
HFMA addresses this problem by defining initial denial rate in two ways. The volume-based formula is total initial denied claims divided by total claims submitted. The dollar-based formula is total initial denied claim gross charges divided by total submitted claim gross charges, as described in HFMA's standardization guidance.

One language across the revenue cycle
Standardization matters because volume and dollars answer different questions. Volume shows how often a workflow fails. Dollar-based measurement shows how much financial exposure those failures create. A small number of high-value denials can matter more than a larger number of low-value claims, while a high-volume registration defect may reveal a process problem that dollar totals hide.
Use the same definitions across departments and reporting periods. Document whether the denominator includes all submitted claims, whether corrected claims are counted separately, and when the initial denial event is recognized. Store the source field from the EHR, practice management system, clearinghouse, remittance file, or payer portal so analysts can reconcile the dashboard back to transaction-level data.
Standardized medical billing metrics also improve accountability. Registration owns demographic and eligibility inputs. Coding owns documentation and code selection. Billing owns claim creation and submission. Follow-up owns payer responses, appeals, and payment variance. Leadership can then assign corrective work without blaming a department for a metric it doesn't control.
The wider dispute environment makes this discipline more valuable. As payer disagreements move into formal arbitration, a provider needs consistent historical data to show what was billed, what was paid, what should have been paid, and how the payer responded. A shared measurement framework turns scattered billing activity into evidence.
Core Medical Billing Metrics and Formulas
A dashboard is only as reliable as its formulas. Before setting targets, write down each calculation, identify its source fields, and decide whether the metric is claim-based, dollar-based, date-of-service-based, or transaction-based.
Start with the claim
Use the claim submission file, clearinghouse response, payer remittance, and denial work queue to separate front-end rejection from initial payer denial. A clean claim rate should reflect claims accepted without correction under your documented definition. First-pass acceptance should show claims accepted or paid without manual intervention, while the denial rate should follow the standardized initial-denial definition rather than a locally improvised version.
| Medical Billing Metric | Formula |
|---|---|
| Volume-based initial denial rate | Total initial denied claims ÷ total claims submitted |
| Dollar-based initial denial rate | Total initial denied claim gross charges ÷ total submitted claim gross charges |
| Clean claim rate | Claims accepted without correction ÷ total claims submitted |
| First-pass acceptance rate | Claims accepted or paid without intervention ÷ total claims submitted |
| Days in A/R | Total receivables, with credits netted out ÷ average daily charges |
| Net collection rate | Payments minus refunds ÷ charges minus contractual adjustments |
Use remittance and contract data to calculate the net collection rate, not just the payment posting total. A payment total can look strong while contractual adjustments, avoidable write-offs, refunds, and unresolved balances conceal leakage.
Calculate A/R consistently
Days in accounts receivable measures how long billed revenue remains unpaid. The calculation divides total receivables by average daily charges, with credits netted out first, and it should be recalculated consistently on a monthly or quarterly basis, according to AAFP practice-finance guidance.
Pull total receivables from the ledger, remove credits before calculation, and derive average daily charges from the same reporting period. Don't mix a current A/R balance with an unrelated charge window. That creates a number that looks precise but can't support operational decisions.
Add the dimensions that explain movement
A single rate rarely identifies the cause. Break results down by payer, location, provider, specialty, procedure family, denial reason, aging bucket, and financial class. Then compare claim volume with claim dollars. If the volume rate improves but dollar exposure worsens, the team may be resolving easy claims while high-value cases remain untouched.
Benchmarking Against Industry Standards
Benchmarks provide a reference point, not a diagnosis. Comparing a small specialty practice with a hospital system can set the wrong target, while broad averages may hide weak payer follow-up or service-line leakage. Start with peers that share the same specialty, payer mix, site of care, and reporting definitions. The AAFP practice-finance resources offer useful context for physician-practice measures.
Common reference points place the initial denial rate at under 5%. Days in A/R are often evaluated against a range of 30 to 40 days, while AAFP-linked guidance describes under 50 days as a minimum target, with 30 to 40 days preferable. Treat these figures as screening thresholds. A practice can meet them while losing substantial reimbursement through underpayments or delayed work on expensive claims.
The pressure is visible in claims data covering more than 1,800 hospital systems and about 200,000 providers. Denied payer claims increased roughly 18% from 2020 through the end of 2023, and about 12% of all initial claims were denied, according to HFMA's denial-metric guidance. Those figures support investigation, not automatic condemnation. Definitions, claim populations, and payer contracts still determine whether a comparison is valid.

Read the gap, not just the score
A cardiology practice with an 85% clean claim rate should investigate whether high-value procedure denials are being missed rather than celebrating volume success. A strong rate can coexist with material dollar leakage when the remaining errors cluster in complex, high-reimbursement services.
Use performance benchmarking to compare like with like. Segment results by payer, service line, and dollar impact before assigning a target. A payer with a high dollar denial rate may require executive escalation even when claim volume is modest. A high-volume, low-dollar registration issue may justify front-end automation instead.
Practical rule: Do not call a poor metric “normal” until specialty mix, payer mix, aging, and measurement method are separated.
Set targets in layers. An enterprise target establishes accountability, a department target assigns ownership, and a payer or reason-code target creates a work queue. Review consistent periods and test whether corrective action improves both claim volume and dollars. Under the No Surprises Act, add measures such as award-to-QPA ratios and IDR outcomes. High arbitration volume makes those results part of reimbursement performance, not a separate compliance report.
Identifying Denials, Underpayments, and Leakage
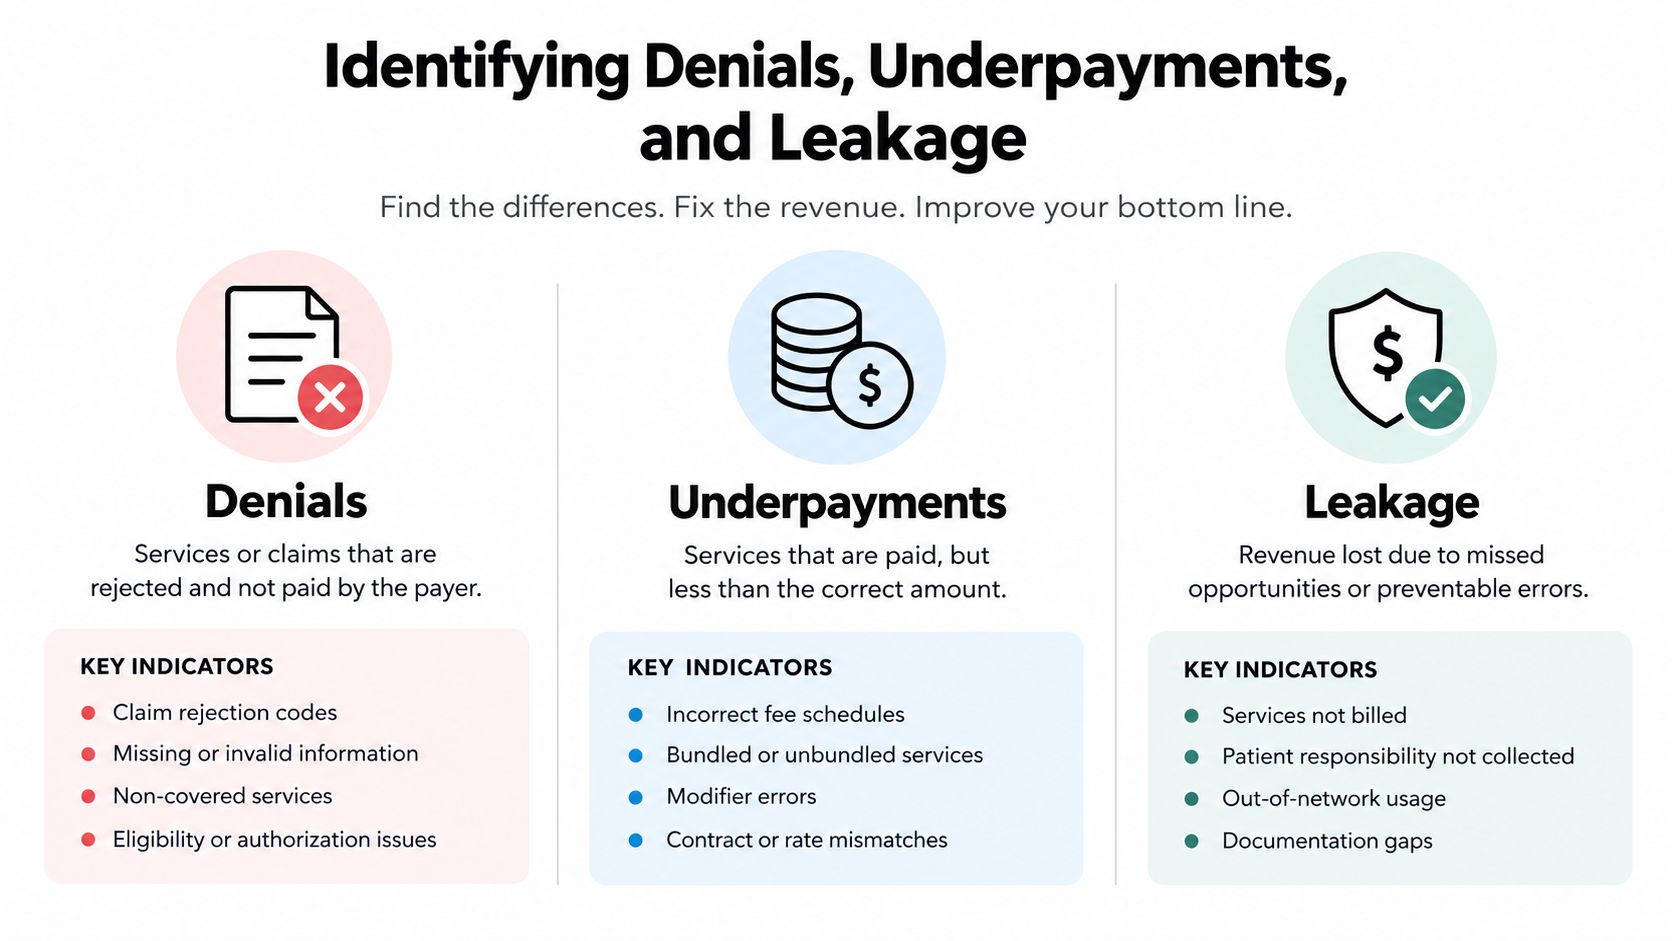
Denials are visible because the payer sends a clear rejection or nonpayment message. Underpayments are harder. The claim closes, cash posts, and the account may disappear from an ordinary work queue even though the payer paid less than the contracted or expected amount.
Industry revenue-cycle guidance identifies a coverage gap in standard education, where denials receive most of the attention while short-pay variance, contract drift, and delayed reimbursement receive less practical treatment.
Separate the failure types
A denial management queue asks why the payer didn't accept or pay the claim and whether the team can correct, appeal, or resubmit it. An underpayment queue asks whether the payer's adjudicated amount matches the expected reimbursement after contractual terms, patient responsibility, and applicable adjustments.
Track these separately:
- Denial dollars: Measure the value of initially denied claims and group it by root cause.
- Underpayment variance: Compare expected allowed reimbursement with the payer's actual adjudicated payment, then retain the claim-level explanation.
- Net collection rate: Assess what the organization collected after refunds against collectible charges after contractual adjustments.
- Write-off and closure reason: Distinguish contractual adjustments from avoidable write-offs, unresolved balances, and administrative closures.
This separation changes prioritization. A coding defect may call for documentation education or charge capture changes. A recurring short pay from one payer may require contract analysis, payer escalation, or IDR preparation. Treating both as “denials” hides the operational owner and delays recovery.
Connect variance to IDR readiness
Underpayment data becomes strategically useful when it includes payer, specialty, procedure, place of service, billed amount, qualifying payment amount, adjudicated amount, and supporting documentation. It can show whether a payer's behavior is isolated or systematic. It can also identify which claims have enough evidence and financial value to justify dispute preparation.
The trade-off is resource allocation. Routine underpayments may be recoverable through corrected claims or payer reconsideration. Other cases need a documented escalation path. A dashboard that combines underpayment rate, variance by payer, appeal outcome, and dispute recovery gives leaders a better basis for deciding where to deploy specialist effort.
Building a Revenue Cycle Dashboard
A useful dashboard starts with decisions, not visuals. Ask what the billing manager needs to act on today, what the CFO needs to understand this month, and what the IDR team needs before filing a dispute. Then map each decision to a metric and a source system.
Build three reporting views
The daily operations view should show new rejections, unworked denials, claims awaiting documentation, payment posting exceptions, and accounts approaching filing or appeal deadlines. Keep it actionable. A large historical chart won't help a follow-up specialist decide which account to open next.
The weekly leadership view should show denial rate by root cause, denial dollars, days in A/R, aging concentration, clean claim performance, net collection rate, underpayment variance, and corrective-action status. Segment by payer and service line so leadership can distinguish a broad workflow problem from a concentrated payer issue.
The dispute view should track eligible cases, submitted cases, open determinations, provider wins, award amounts, qualifying payment amounts, award-to-QPA ratio, and recovery by payer. Use the same claim identifiers as the RCM system. Otherwise, the organization can't reconcile arbitration results with the original payment record.
Design for ownership
Every tile should have a definition, refresh cadence, accountable owner, and threshold that triggers review. The EHR and practice management system provide encounter, charge, provider, and patient data. The clearinghouse supplies acceptance and rejection responses. Remittance files provide adjudication and payment details. Contract modeling and dispute records add expected reimbursement and IDR outcomes.
Use trend lines for movement, ranked tables for payer comparisons, and drill-down links to account-level evidence. Don't display a red metric without showing the underlying claims. A dashboard should shorten the path from signal to work queue, not create another report that staff must manually interpret.
Linking Metrics to RCM and IDR Strategy
Metrics should determine the next operational action. A rising denial rate points the team toward eligibility, authorization, documentation, coding, or charge capture. A persistent underpayment variance points toward contract validation, payer escalation, negotiation, or IDR review.
Close the loop by trigger
Use a workflow that assigns each signal to an owner:
- Detect the pattern: Segment results by payer, reason, provider, procedure, and dollars.
- Validate the record: Reconcile the claim, remittance, contract expectation, documentation, and posted payment.
- Correct the source: Fix registration, authorization, coding, submission, or payer-follow-up defects.
- Escalate the right cases: Route repeat or material underpayments into a documented dispute pathway.
- Measure the result: Track corrected claims, recovered dollars, closure time, and payer behavior after intervention.
The No Surprises Act IDR workflow should receive linked claim history, service documentation, payment records, contract context, and payer communications. Building that evidence trail before a dispute separates a correctable billing defect from a payment dispute worth pursuing.
The No Surprises Act has made arbitration outcomes part of revenue-cycle management. High-volume IDR arbitration creates new KPIs alongside denial rate and days in A/R, including case-selection rate, evidence completeness, award-to-QPA ratio, net recovery, and cost per resolved dispute. These measures show whether a payer issue warrants escalation and whether the recovery justifies staff time and filing expense.
For example, when the dispute view shows an award-to-QPA ratio above 115% for a payer, the trigger should automatically escalate the account to the IDR team within 48 hours. The team can then verify eligibility, evidence, filing status, and expected recovery before the deadline or payment opportunity is lost.
A mature revenue cycle runs two connected loops. The first prevents avoidable leakage before submission. The second protects payment value when payer behavior persists. Medical billing metrics provide the operating controls for both.
RevGuard combines specialty-specific RCM with No Surprises Act IDR workflows, using dashboards to track denials, underpayment variance, payer behavior, and dispute outcomes. Teams seeking to connect claim-level billing data with evidence-backed recovery actions can visit RevGuard to evaluate the workflow.