

A net collection rate below 90% is a practical warning sign that revenue is leaking through more than one process, not that a few claims were written off. Industry guidance identifies denial management, underpayment follow-up, weak patient collections, and charge or enrollment problems as common sources of that leakage, while a 90% rate on a practice billing $5 million annually can represent roughly $500,000 in collectible revenue not realized versus a 100% benchmark, as explained by FloBotics' net collection rate analysis.
That's why the metric deserves more than a place on a monthly dashboard. Net collection rate tells you how much of the revenue your contracts and patient balances made collectible reached the practice. The useful question isn't whether your billing team submitted claims. It's which upstream failure prevented collectible revenue from becoming cash.
Why Net Collection Rate Is the Number That Actually Matters
Most revenue cycle dashboards are busy, not decisive. They show claim volume, clean submissions, aging, payment posting, and denial counts. Those indicators help manage work, but they don't answer the financial question practice leaders ultimately face: How much of the revenue we were entitled to collect did we keep?
A gross collection rate divides payments by gross charges. That comparison is distorted from the start because gross charges include amounts no payer was obligated to reimburse. A practice can alter its charge master and change the gross rate without improving actual cash performance. Net collection rate removes that noise by measuring payments against revenue remaining after contractual adjustments.
The denominator determines the truth
The standard net collection rate calculation is:
Payments received ÷ net collectible revenue × 100
Net collectible revenue is generally calculated as gross charges minus contractual adjustments. Those adjustments represent payer-negotiated reductions, not avoidable losses. The resulting denominator reflects what the practice was contractually allowed to collect.
Adjusted collection rate reporting can still mislead when the contractual adjustment is wrong, incomplete, or mixed with avoidable write-offs. If a payer underpays and the posting team accepts the payment as correct, the practice may classify the missing amount incorrectly and make the performance picture look cleaner than it is.
Practical rule: If your dashboard can't separate contractual adjustments, bad debt, refunds, recoupments, and avoidable write-offs, the rate may be mathematically correct but operationally unreliable.
Treat the rate as a diagnostic scorecard
A strong rate is commonly associated with performance near 100%, with practical guidance often citing 97% or higher as a strong target and below 90% as a warning sign, according to the Net Collection Rate glossary from Stratevora. Those thresholds are useful for triage, but they don't tell you what to fix.
A lower rate can come from preventable denials, payer underpayments, patient balances that age without effective follow-up, or credentialing and eligibility failures. The practice manager's job is to split the gap into those leak lines, assign each one to an owner, and measure whether the correction changes cash. That approach is more useful than asking a billing vendor to “improve collections” without identifying the process responsible.
The Net Collection Rate Formula, Built From the Ground Up
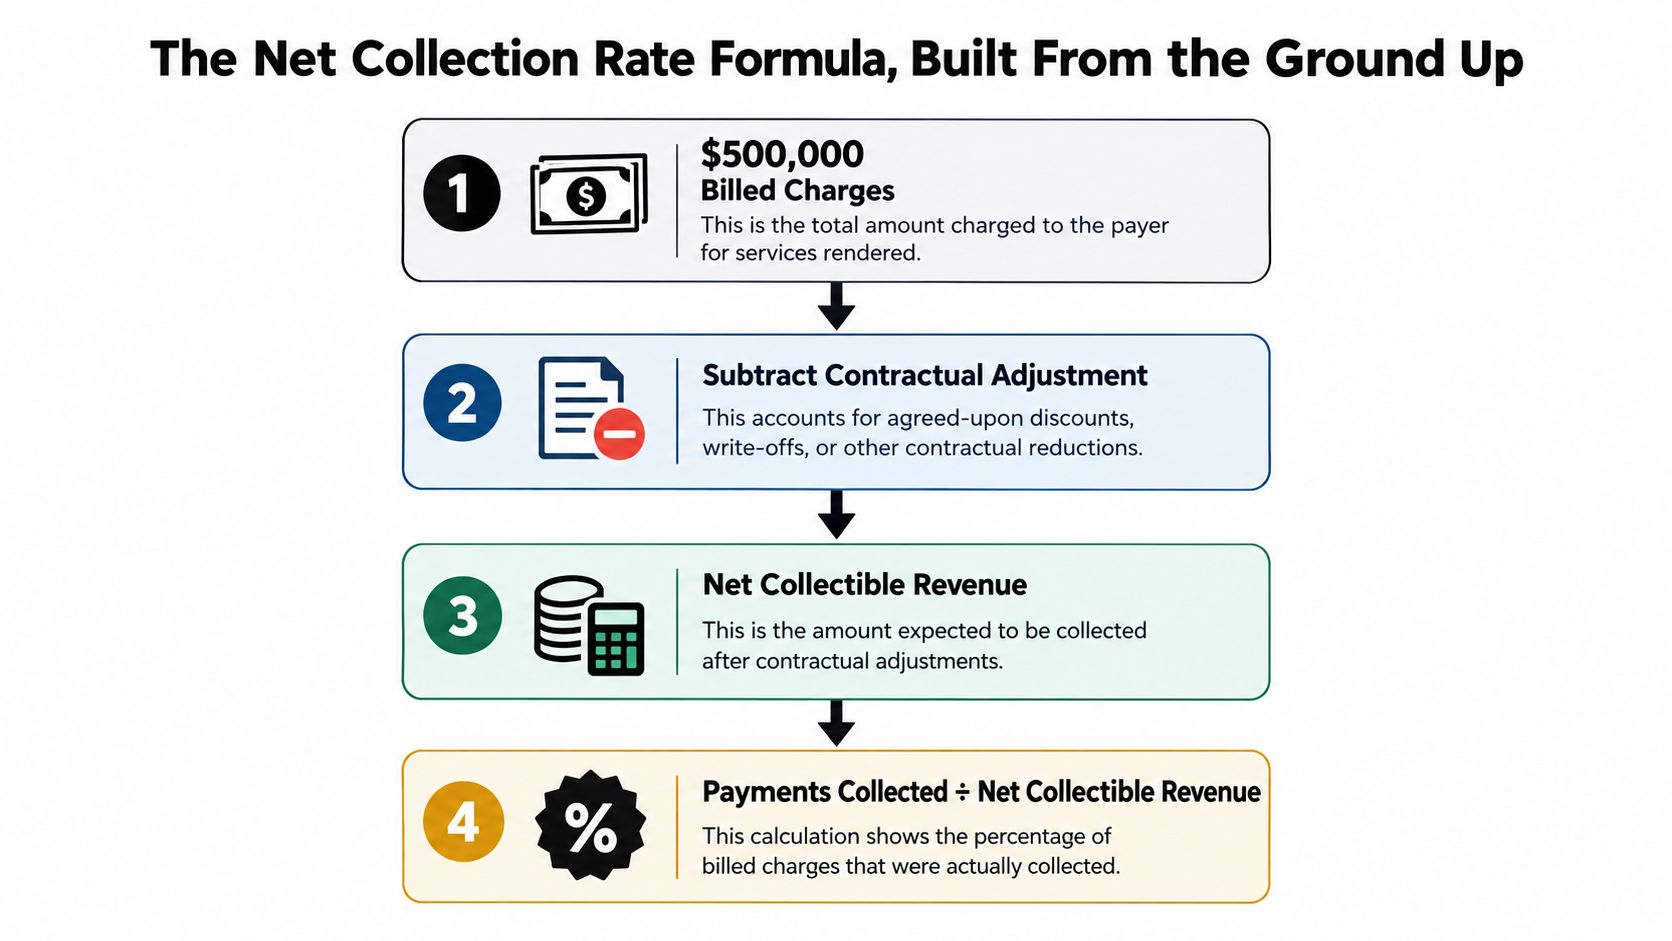
Net collection rate is only useful when each part of the equation reflects a real operational event. Start with gross charges, remove contractual adjustments, then compare the collectible amount with eligible cash posted. For a practice with $500,000 in gross charges and $280,000 in contractual adjustments, the collectible base is $220,000.
If eligible payments total $209,000 after refunds and relevant recoupments, the rate is 95%:
$209,000 ÷ ($500,000 − $280,000) × 100 = 95%
The standard healthcare revenue cycle management formula is payments ÷ (gross charges − contractual adjustments) × 100, as described in this healthcare RCM KPI guide from Medheave.
Choose the reporting window before judging performance
A monthly rate supports daily management, but payment timing can make it volatile. Claims adjudicate, denials appeal, and patient balances pay on different schedules. A trailing 12-month window usually provides a steadier view, and Enter Health's medical billing metrics guide warns that shorter periods can be distorted by payment lags.
Use a 90-day view for faster intervention, provided the data has enough runout. Define the measurement period and apply identical rules each time. Comparing a newly billed month with a mature month produces a timing difference, not a reliable performance comparison.
For management reporting, use cash posted minus refunds. Include insurance and patient payments tied to the collectible base, remove returned funds and payer recoupments that reduce realized cash, and keep bad debt and charity care separate from contractual adjustments. Track denials, patient-pay aging, and underpayments beside the rate so the dashboard shows which upstream failure is lowering it. Revenue cycle management metrics from RevGuard can help organize those related measures.
Specialty Benchmarks and What They Really Tell You
A benchmark can tell you that a rate deserves investigation. It can't tell you whether the denominator is clean or whether your payer mix makes the comparison fair. Published benchmark summaries commonly place best-in-class organizations above 96%, average performance around 91% to 95%, and underperforming organizations below 88%, according to Revenue Synergy's 2026 RCM benchmark summary.
Use the following comparison as a directional management tool, not as a promise that every specialty should produce the same result.
Compare the operating environment, not only the percentage
| Specialty | Typical NCR Range | Key Driver of Spread |
|---|---|---|
| Primary care | 95% to 99% | Eligibility accuracy, high visit volume, and patient balance follow-up |
| Behavioral health | 92% to 97% | Authorization rules, coverage limits, and patient responsibility |
| Orthopedics | 93% to 97% | Procedure coding, modifiers, global-period rules, and payer contract variance |
| OB/GYN | 94% to 98% | Global billing, maternity coverage, authorization, and payer mix |
| Emergency medicine | 88% to 94% | Out-of-network exposure, complex adjudication, and patient responsibility |
The ranges differ because each specialty carries a different mix of payer contracts, patient-pay exposure, facility relationships, high-deductible plans, and procedural complexity. Emergency medicine may face a more difficult reimbursement environment than a largely in-network primary care practice, while orthopedics can lose significant collectible revenue through coding, bundling, and contract-loading errors.
A published 97% rate may reflect excellent collections, but it may also exclude patient collections or rely on a denominator that hasn't matured. A 95% rate at another practice may be concerning if patient-pay revenue is included, refunds are handled correctly, and the trailing trend is falling.
Don't chase an external percentile before you understand your own trailing-twelve-month trend, payer segmentation, and adjustment classification.
Track the aggregate rate, then segment it by payer, provider, procedure family, denial reason, and patient responsibility. The segment that moves downward is usually more actionable than the blended score.
Worked Examples on Realistic Charge Volumes
The percentage is only useful when you translate it into collectible dollars. These examples show how to calculate the rate, identify the gap, and avoid confusing gross activity with realized revenue.
Primary care example
A primary care practice posts $420,000 in gross charges. Contractual adjustments total $85,000, leaving a collectible base of $335,000. Payments total $310,000.
$310,000 ÷ $335,000 × 100 = 92.5%
The uncollected portion of the collectible base is $25,000. That gap might include unresolved denials, patient balances, underpayments, or timing that hasn't matured. It shouldn't be written off as a generic “billing issue” until the team identifies the source.
Orthopedic example
A two-physician orthopedic group posts $680,000 in gross charges. If the group's net collection rate is 88%, the collectible base and payment amount must be reviewed together. Heavy denial rework and a $40,000 patient balance aging past 90 days are warning indicators, but the group still needs its contractual-adjustment total and payment-posting rules before anyone can validate the final rate.
| Line Item | Primary Care Example | Orthopedic Example |
|---|---|---|
| Gross charges | $420,000 | $680,000 |
| Contractual adjustments | $85,000 | Must be confirmed from the ledger |
| Collectible base | $335,000 | Must be confirmed from the ledger |
| Payments | $310,000 | Must be reconciled to the collectible base |
| Reported net collection rate | 92.5% | 88% |
| Immediate concern | $25,000 collectible gap | Denial rework and patient balance aging |
The orthopedic case demonstrates why a rate alone isn't a diagnosis. If the $40,000 patient balance is included in the collectible base but later written off, the rate will fall. If payments post late, the current month may look worse before the cash arrives. If a refund or payer recoupment is recorded in a different month, the numerator may look artificially strong or weak.
Don't convert these examples into a per-visit loss without a validated encounter count. The correct calculation is straightforward once that count exists: collectible gap divided by average encounters. Use actual visits or procedures from the same reporting period, not a volume estimate.
Calculation Pitfalls That Quietly Distort Your Rate
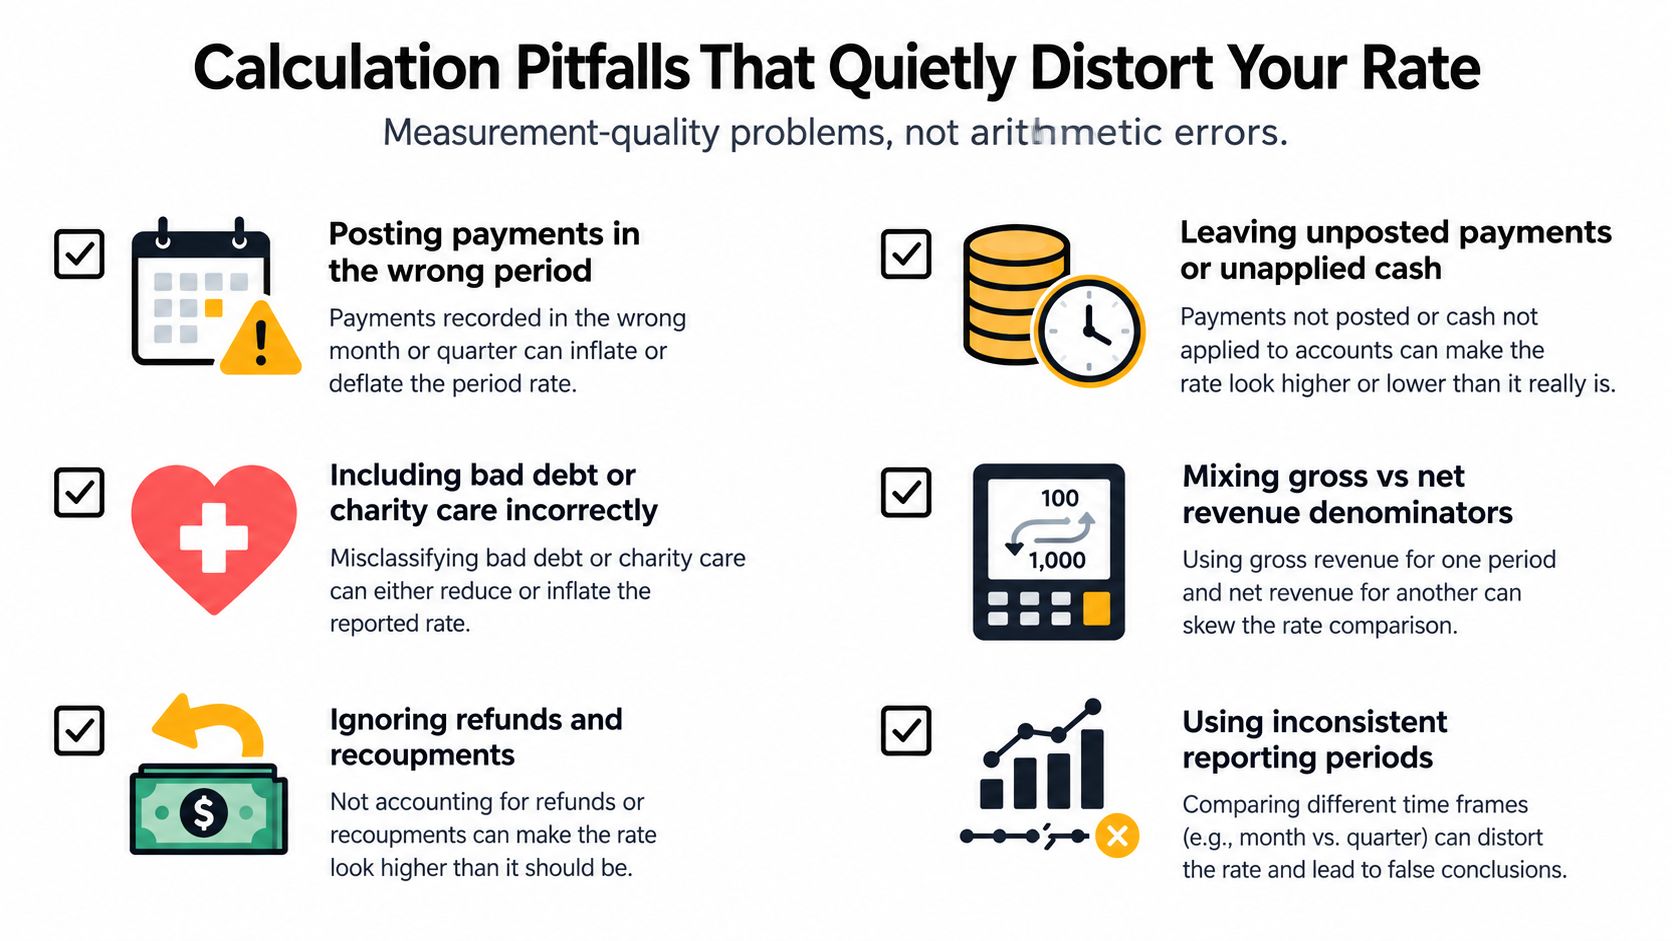
The arithmetic is easy. The inputs are dirty. Most misleading net collection rates come from measurement-quality problems that make a practice look healthier or weaker than its underlying performance.
Six checks before you trust the result
- Posting period mismatch: Payments posted after adjudication can inflate one period and depress another. Match the numerator to a defined reporting window and use a runout approach.
- Unapplied cash and credit balances: Cash left unapplied, unresolved credit balances, or refunds not yet processed can distort both the numerator and the account history.
- Contractual adjustment errors: Excluding contractual adjustments makes the denominator too large. Double-counting them makes it too small.
- Bad debt classification: Fee-schedule write-offs belong in a different category from bad debt, charity care, or avoidable administrative write-offs.
- Recoupment timing: A payer recoupment recorded months after the original remittance changes realized cash and may need to be associated with the original claim period for analysis.
- Patient payment assumptions: A payment plan isn't the same as cash collected. Don't treat an unpaid promise as fully collectible.
A monthly snapshot without adequate runout is especially risky. Payment timing, refunds, and payer adjudication cycles can shift the apparent result even when the underlying workflow hasn't changed. Review the posting rules with your billing team and document what counts in the numerator and denominator.
Use a consistent remittance workflow, such as the one described in RevGuard's remittance processing resource, to keep payment, adjustment, recoupment, and refund treatment visible. If a reported rate appears unusually healthy, test it against aged claims and later payment activity rather than accepting the number at face value.
What a Low Rate Is Actually Telling You
A low net collection rate is not a diagnosis. It's the final score produced by several upstream processes. Recent reporting placed initial claim denial rates at 11.81% in 2024, with 41% of providers reporting denial rates above 10%, while net revenue losses from final denials and bad debt grew 25% in 2025, according to Clarity RCM's practice benchmarking report.
Those figures explain why a practice shouldn't respond to a weak rate by telling billers to work harder. The manager needs to identify which failure line is consuming collectible revenue.
Diagnose the gap by source
Denials and preventable rejections point to front-end verification, authorization, coding, documentation, or claim-edit problems. Separate initial rejections from payer denials, then sort denials by payer, code, provider, and root cause. A high-volume eligibility error requires a different intervention from a medical-necessity denial supported by missing documentation.
Underpayments occur when the remittance is below the contracted allowable and the variance isn't pursued. The issue lives in contract loading, fee-schedule maintenance, payment posting, or follow-up. A clean claim can still produce a poor net collection rate if the payer pays incorrectly and the practice accepts the result.
Patient-pay leakage begins after adjudication. Patient responsibility that ages without a clear estimate, statement sequence, payment option, or escalation path eventually becomes harder to collect. Enter Health reported insured patient collection rates of 34.46% in 2024, a data point that shows why contractual collection performance can remain stable while patient-pay weakness drags down the overall result.
Credentialing and eligibility gaps can force full or partial write-offs when the provider, location, taxonomy, authorization, or coverage status is wrong. These failures belong to enrollment, contracting, scheduling, and front-desk ownership, not only to billing.
The fix follows the leak. A denial problem needs root-cause prevention, an underpayment problem needs contract variance analysis, and a patient-pay problem needs a stronger post-adjudication workflow.
A Practical Playbook to Improve Net Collection Rate
Start with the lever that removes work before the claim leaves the practice. Verify eligibility and authorization during scheduling, then repeat the check when coverage or appointment details change. The front desk owns the data capture, coding owns claim accuracy, and billing owns submission controls. Assigning a named owner matters more than adding another undifferentiated RCM report.
Sequence the work by leverage
Scrub preventable claim defects first. Use specialty-specific edits for modifiers, bundling, authorization, diagnosis support, and missing documentation. Review denials weekly by root cause and payer, then fix the source rule instead of repeatedly correcting the same claim.
Build a payer underpayment worklist. Load current contract terms and compare expected allowed amounts with actual remittance results. Give payment posting or AR follow-up a clear escalation path, including the contract provision, claim detail, remittance evidence, and requested correction.
Make patient responsibility actionable. Provide estimates before service when possible, collect appropriate amounts at check-in, and use a documented statement and outreach sequence after adjudication. Patient-pay work should be segmented by balance, age, payer, and prior response, not treated as one aging bucket.
Audit credentialing and enrollment. Reconcile providers, locations, payers, effective dates, taxonomy, and participation status. A credentialing gap that prevents payment can't be solved by sending the same claim again.
| Lever | Driver Addressed | Owner | Typical NCR Gain | Dispute-Ready Output |
|---|---|---|---|---|
| Eligibility and authorization controls | Preventable denials | Front desk and scheduling | Depends on baseline leakage | Verification record and authorization evidence |
| Specialty claim scrubbing | Coding and documentation denials | Coding and billing | Depends on denial concentration | Corrected claim, coding rationale, and records |
| Contract variance monitoring | Payer underpayments | Payment posting and AR | Depends on payer behavior | Contract clause, expected rate, remittance, and appeal |
| Patient-pay workflow | Aging patient balances | Patient financial services | Depends on patient-pay mix | Estimate, statements, outreach history, and payment record |
| Credentialing audit | Enrollment and participation gaps | Credentialing and administration | Depends on affected volume | Enrollment file, effective-date proof, and payer correspondence |
The improvement objective isn't a benchmark number in isolation. It's recoverable cash with a defensible audit trail. For practices that need structured follow-up across aging, payer behavior, and unresolved balances, RevGuard's accounts receivable management is one operational model to evaluate.
Strong documentation also protects the dispute pathway. When a commercial payer repeatedly underpays, maintain the contract, claim, remittance, correspondence, medical record support, and calculation of the variance in one file. That evidence supports escalation and, where applicable, an Independent Dispute Resolution submission.
Pulling It Together Into a 30-60-90 Day Operating View
A useful operating view connects the net collection rate to the failures that move it: denials, patient balances, and payer underpayments. Keep the dashboard focused on net collection rate, days in accounts receivable, initial denial rate, and patient accounts receivable over 90 days. Each metric should support an action, not fill a screen.
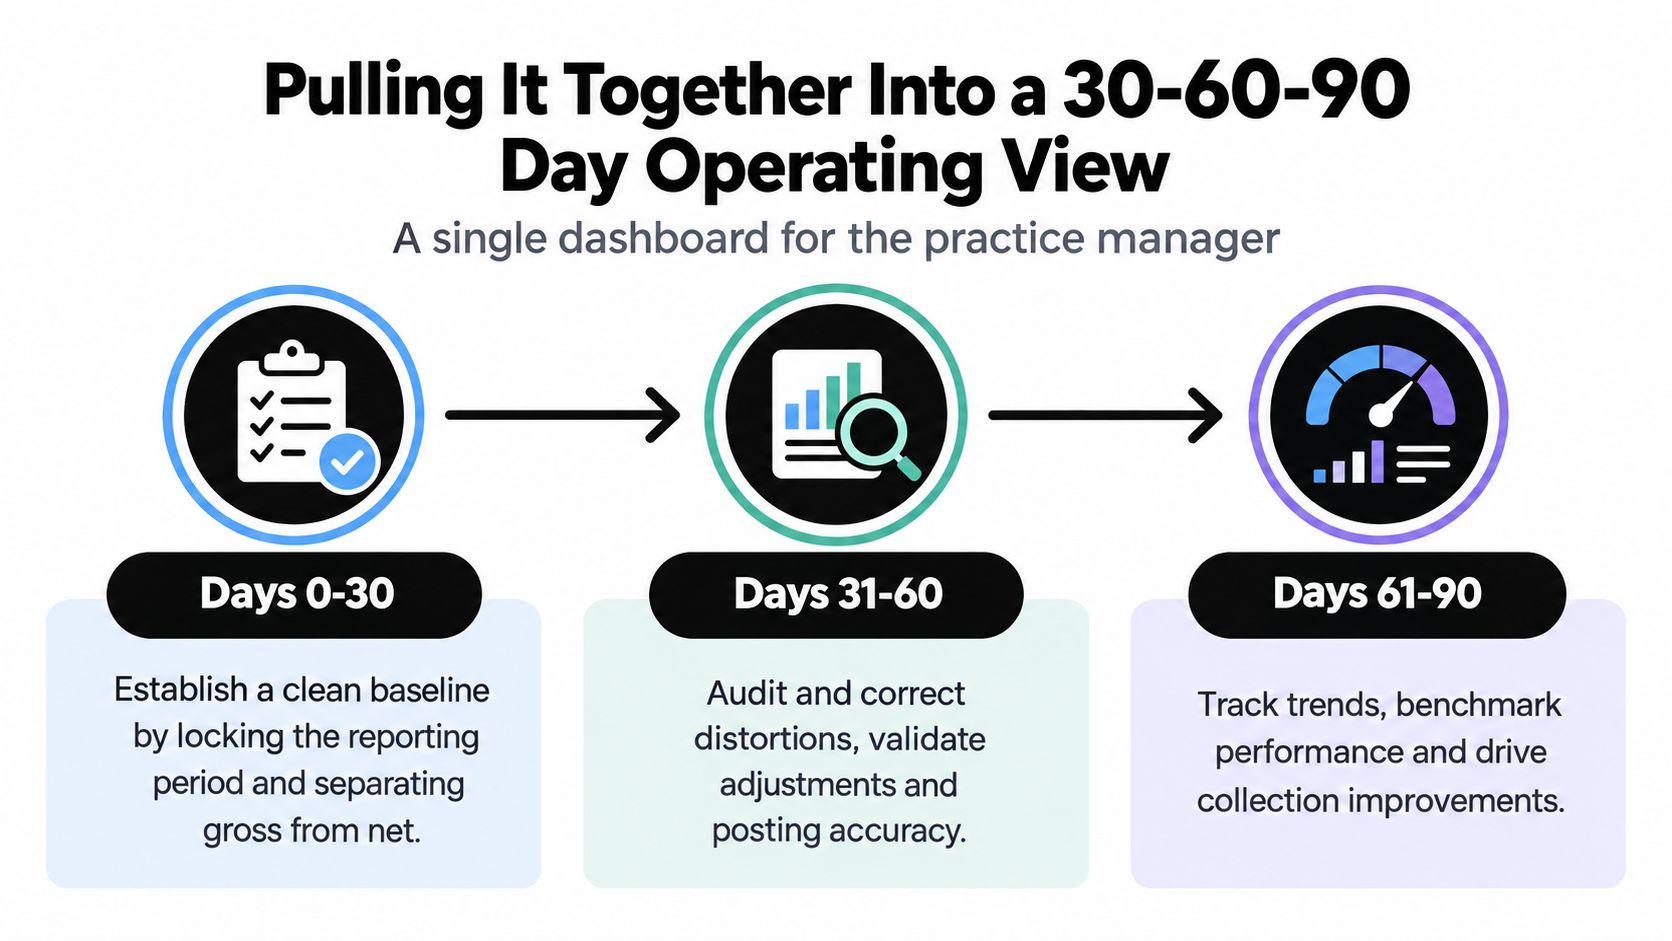
Days 0 to 30
Set the reporting definition before changing workflows. Separate contractual adjustments from avoidable write-offs, refunds, recoupments, charity care, and bad debt. Reconcile the numerator to posted cash, document the look-back window, and establish a clean baseline.
Review the indicators weekly. Segment denials by cause, patient balances by aging, and payment variances by payer. A stable aggregate rate can hide a worsening failure point.
Days 31 to 60
Fix the upstream leaks in order of recoverable cash. Tighten eligibility verification at scheduling, strengthen point-of-service collection, and assign payer underpayments to a worklist. Give credentialing remediation to a named administrator.
Track whether each intervention changes its related segment. Denials should fall after claim and eligibility corrections. Patient balances should respond to clearer estimates and follow-up. Payment variances should produce documented appeals. If the aggregate rate remains flat, inspect the segments before changing the strategy.
Days 61 to 90
Measure the deltas, formalize the weekly cadence, and preserve documentation for payer escalation and IDR-ready disputes. Set the next quarter's target from the clean baseline and the practice's actual payer and patient-pay mix.
Benchmark ranges are useful context, but they are not an operating target. Do not chase 100% by changing the formula or excluding difficult balances. A reproducible trend with transparent inputs is more valuable than a headline rate no one can audit.
RevGuard connects specialty-specific revenue cycle management with payer underpayment and dispute workflows. Its analytics, claim documentation, AR processes, and dispute-ready support can be evaluated against a practice's 30-60-90 day plan at RevGuard.