

Denial management is the closed-loop discipline of preventing, identifying, analyzing, correcting, appealing, and resolving denied or underpaid healthcare claims. In 2023, HealthCare.gov insurers reported an average denial rate of 20% for in-network claims, while out-of-network claims had a 36% denial rate, making denial management a core financial operating function rather than a billing cleanup task.
The scale changes how leaders should think about the work. Insurers participating in HealthCare.gov reported approximately 471 million claims in 2023, including 436 million in-network claims. About 86 million in-network claims were denied, according to KFF's analysis of marketplace claims data. A specialty practice, hospital, ASC, or emergency provider doesn't need marketplace-scale volume for the same operating lesson to apply. Every denial is a signal about a breakdown in eligibility, authorization, registration, documentation, coding, payer policy, submission timing, or follow-up.
A strong program doesn't ask only, “How do we get this claim paid?” It also asks, “Why did this happen, who owns the cause, how much is recoverable, and what must change so the next claim doesn't fail?”
Denial Management in Plain Language
What is denial management? It is the coordinated work of preventing payment failures, identifying them after adjudication, correcting or appealing the affected claims, and changing the workflow that caused them. The process begins before submission and continues through payment posting, deadline tracking, root-cause review, and follow-up testing.
Denial management differs from denial prevention. Prevention reduces avoidable failures before a claim reaches the payer. Management handles the full event when a claim is denied or underpaid, then converts the outcome into a control for future claims. A gastroenterology practice, for example, might use eligibility verification and authorization checks before a procedure, then review the denial if the payer still rejects the claim.
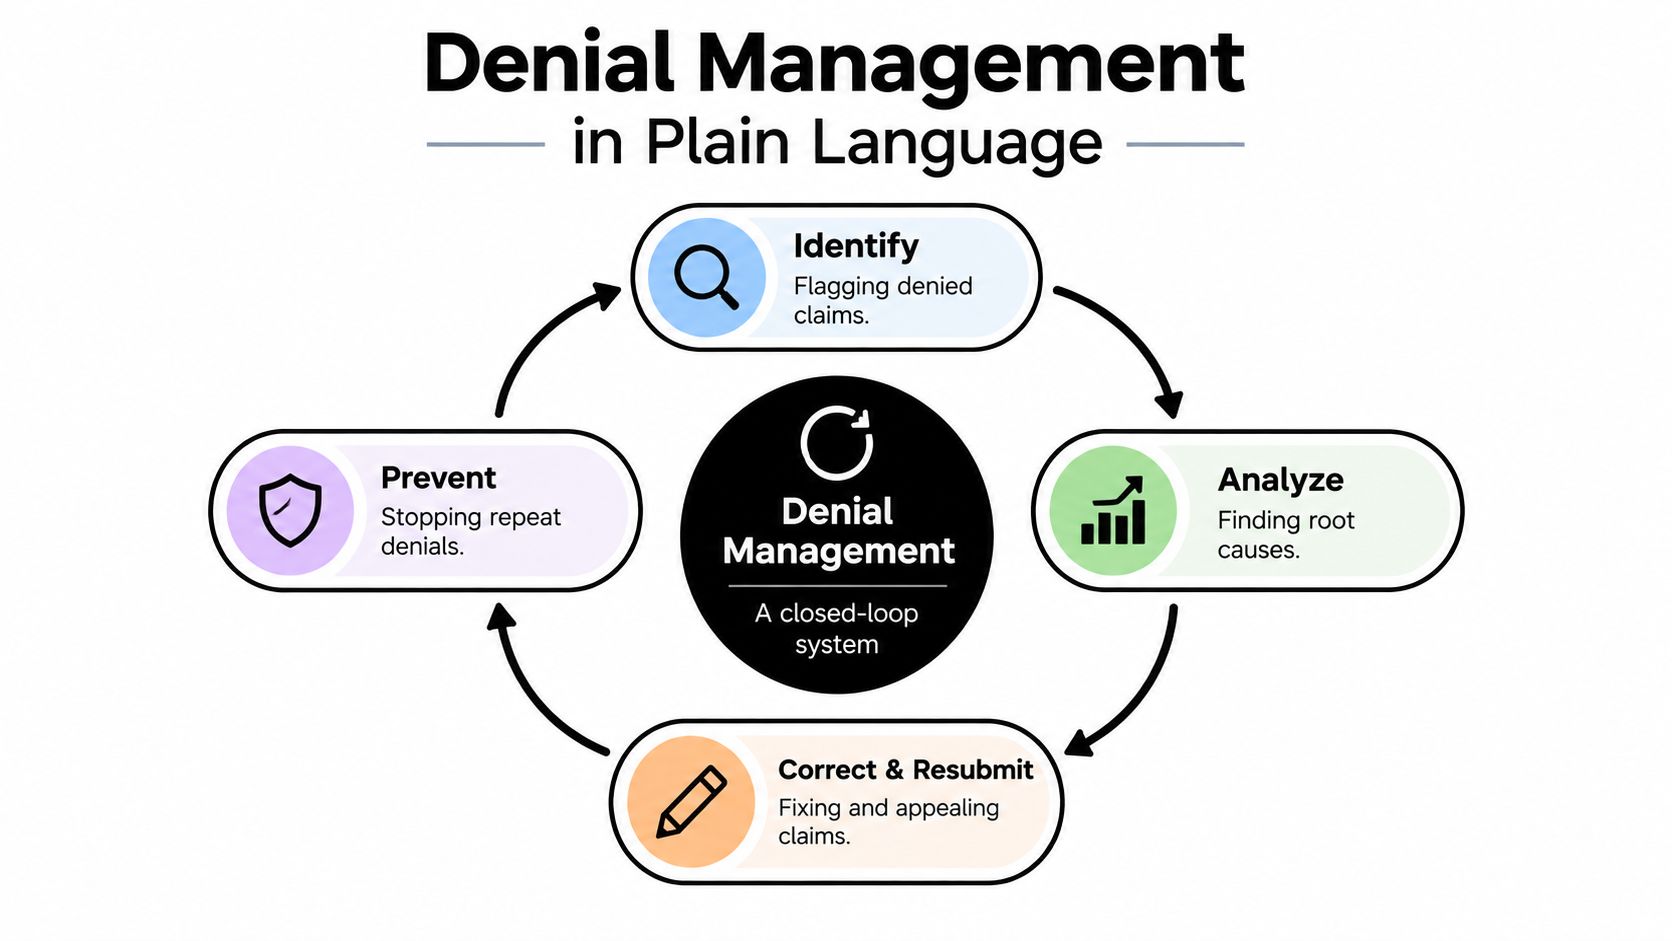
The four questions behind every denial
A practical team definition follows each claim through four questions:
- What happened? Identify the denial or underpayment, record the payer's reason, capture relevant dates, and protect appeal and filing deadlines.
- Why did it happen? Separate the payer's message from the operational cause. “Authorization missing” could mean staff never checked the requirement, the approval was not attached, or the payer's authorization record did not match the submitted claim.
- What should happen next? Correct and resubmit a claim with a fixable defect. Appeal when the decision conflicts with the medical record, contract, payer policy, or applicable rules.
- How do we stop recurrence? Assign the cause to a workflow owner, update the related edit or checklist, and monitor whether the issue repeats by payer, provider, procedure, or location.
These questions keep denial work from becoming a back-end queue alone. An anesthesia practice may need separate controls for coverage, provider enrollment, modifiers, and out-of-network payment disputes. A specialty group also needs clear ownership across scheduling, clinical documentation, coding, billing, and follow-up.
Operational rule: Treat every resolved denial as both a financial transaction and a process-defect record.
The financial record shows whether the claim was paid, adjusted, appealed, or written off. The defect record shows whether the organization learned from the event. That second layer supports cleaner claim engineering upstream and gives the team better evidence when it later addresses underpayments or No Surprises Act IDR disputes. Without it, staff may recover individual claims while the same failure continues across clinicians, locations, and payers.
The Most Common Denial Types and Root Causes
Denials become manageable when teams classify them by the workflow that can prevent them. A reason code is a starting point, not always the full explanation. The same payer message can result from a registration error, a missing authorization, a coding mismatch, or documentation that doesn't support the billed service.
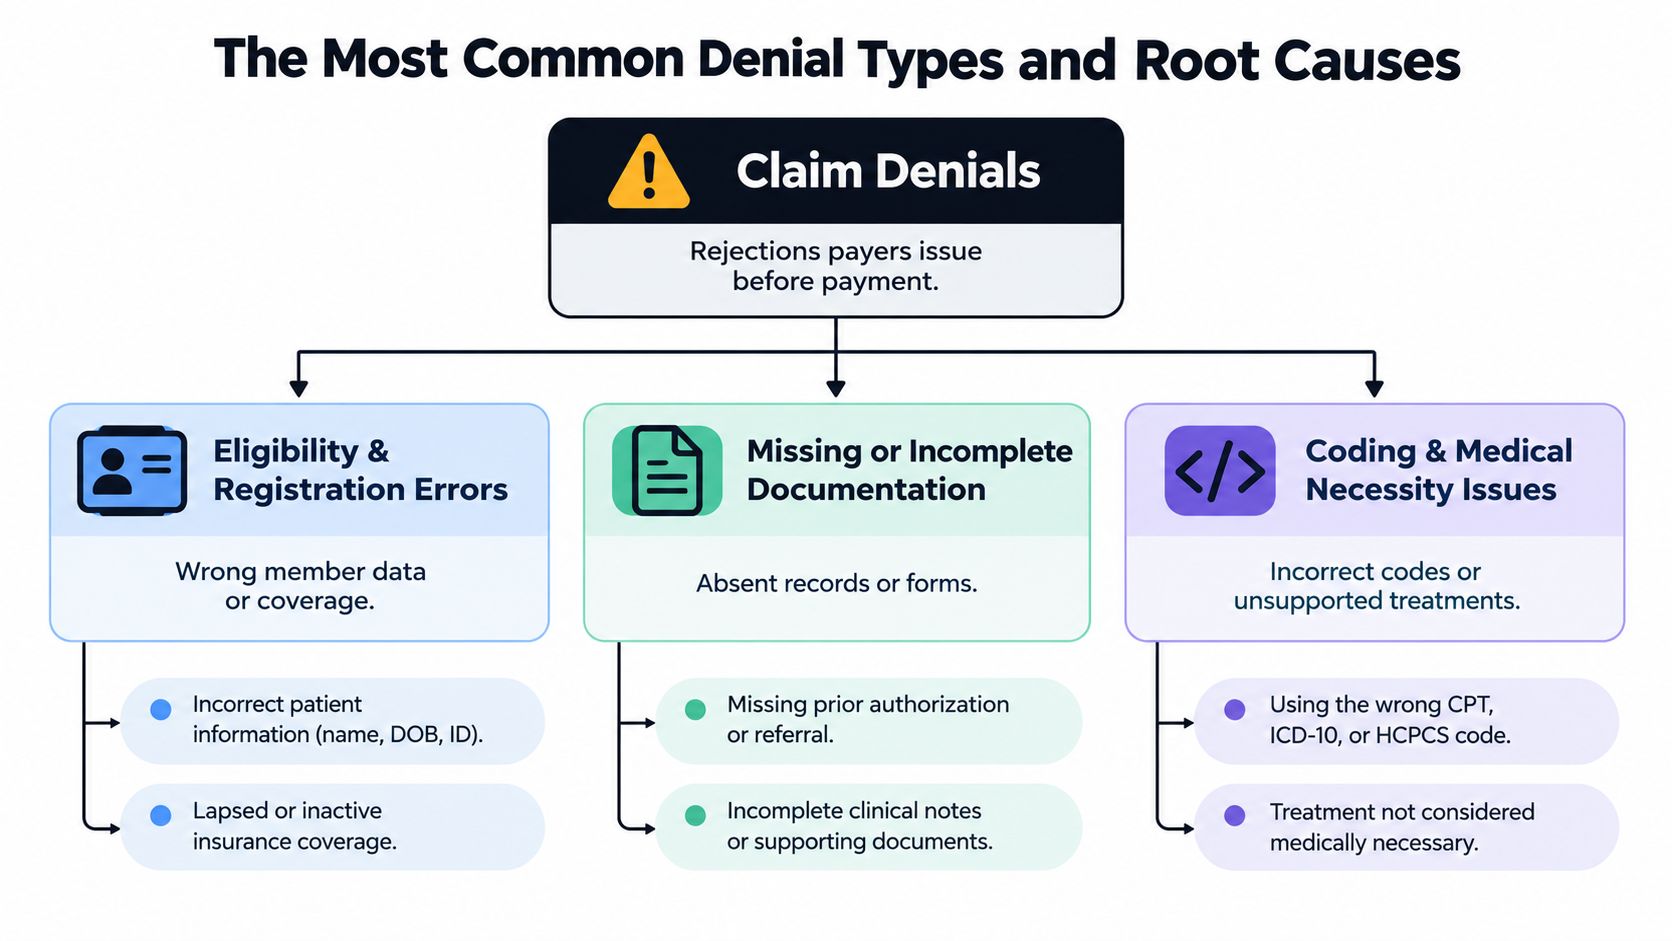
Administrative and front-end causes
Eligibility and registration errors occur when coverage is inactive, the member identifier is wrong, demographic data doesn't match payer records, or the wrong plan is attached to the encounter. The patient access team owns the prevention opportunity, but billing often discovers the defect only after adjudication.
Authorization and referral failures affect services that require advance approval or a referral. The root cause may be an absent authorization, an authorization for the wrong procedure, an expired approval, or a mismatch between the approved provider, facility, service date, and submitted claim. An orthopedic ASC should connect scheduling, authorization capture, coding, and claim scrubbing rather than treating these as separate handoffs.
Credentialing and payer enrollment gaps can produce denials even when the clinical service was appropriate. A multi-state specialty platform needs visibility into provider enrollment by payer, location, taxonomy, and effective date. Ownership should sit with credentialing and payer operations, with billing edits that prevent submission when a known enrollment conflict exists.
Clinical, coding, and documentation causes
CMS reports that, for overall Medicare Evaluation and Management services in the 2024 reporting period, incorrect coding accounted for 49.1% of improper payments, insufficient documentation accounted for 34.1%, and no documentation accounted for 13.1%. Together, those categories represented 96.9% of reported errors, according to the CMS improper payments fact sheet.
That finding makes coding and documentation payment-validity controls, not clerical finishing steps. The code must match the documented service, the clinical facts must support medical necessity, and the record must contain the evidence required by the payer. A clinical denial may require physician review, a coding correction, additional records, or a formal appeal supported by the medical record.
Teams can use claim denial scenarios to build a root-cause library that maps each category to a prevention owner, correction path, evidence requirement, and escalation rule.
Technical and timing causes
Timely-filing misses, duplicate claims, missing attachments, non-covered services, and coordination-of-benefits problems can defeat an otherwise valid claim. These failures often expose weak queue management rather than a clinical problem.
The practical question is always: which workflow could have prevented this denial before submission? That answer should determine the corrective action, not the department that happens to receive the remittance advice.
The KPIs That Actually Measure a Denial Program
A denial dashboard should distinguish financial exposure, operational workload, and learning quality. A single denial-rate figure can't show whether the organization is losing a few high-value claims, reworking many low-value claims, or resolving denials too slowly to protect cash flow.
HFMA recommends measuring initial denial rate by both claim volume and dollars, denial write-offs as a percentage of net patient service revenue, time from denial to appeal, time to resolution, and the percentage of denials overturned, as described in HFMA's denial management guidance.
What each measure tells leadership
- Initial denial rate by claim count: Shows how frequently claims fail at first adjudication. Segment it by payer, specialty, location, provider, procedure, and denial category.
- Initial denial rate by dollars: Shows the financial weight of those failures. A small number of expensive surgical or emergency claims can matter more than a large volume of low-dollar administrative denials.
- Denial write-offs as a percentage of net patient service revenue: Shows how much earned revenue the organization abandons after accounting for its operating revenue base.
- Time from denial to appeal: Shows whether staff identify and act before evidence becomes difficult to retrieve or a deadline expires.
- Time to resolution: Shows how long cash remains trapped in denial inventory. A high overturn rate doesn't compensate for slow resolution when liquidity is under pressure.
- Percentage of denials overturned: Shows the effectiveness of correction and appeal work, but only when read alongside labor cost, recovery value, and resolution time.
A team-level board can add clean-claim rate, preventable-denial rate, denial aging, and recurring root causes. Executives should see dollars, write-offs, resolution time, and recovery. Managers need the operational detail that explains movement in those results.
| KPI | What it measures | Failure mode it exposes |
|---|---|---|
| Initial denial rate by volume | Frequency of first-pass failure | Widespread process defects |
| Initial denial rate by dollars | Financial exposure | High-value leakage hidden by claim counts |
| Denial write-offs as a percentage of net patient service revenue | Revenue abandoned | Weak recovery or unresolvable claims |
| Time from denial to appeal | Response speed | Missed deadlines and delayed evidence gathering |
| Time to resolution | Denial inventory duration | Cash-flow drag and stalled ownership |
| Percentage overturned | Appeal and correction effectiveness | Poor evidence, wrong routing, or weak payer strategy |
Use denial management analytics to connect these measures to payer behavior and root-cause trends rather than treating the dashboard as a static report.
How a KPI-Driven Denial Workflow Runs in Practice
Consider a single anesthesia claim linked to a surgical encounter. Before submission, the team verifies coverage, confirms whether authorization applies, checks the provider's enrollment status, and validates that the documented service supports the selected codes and modifiers.
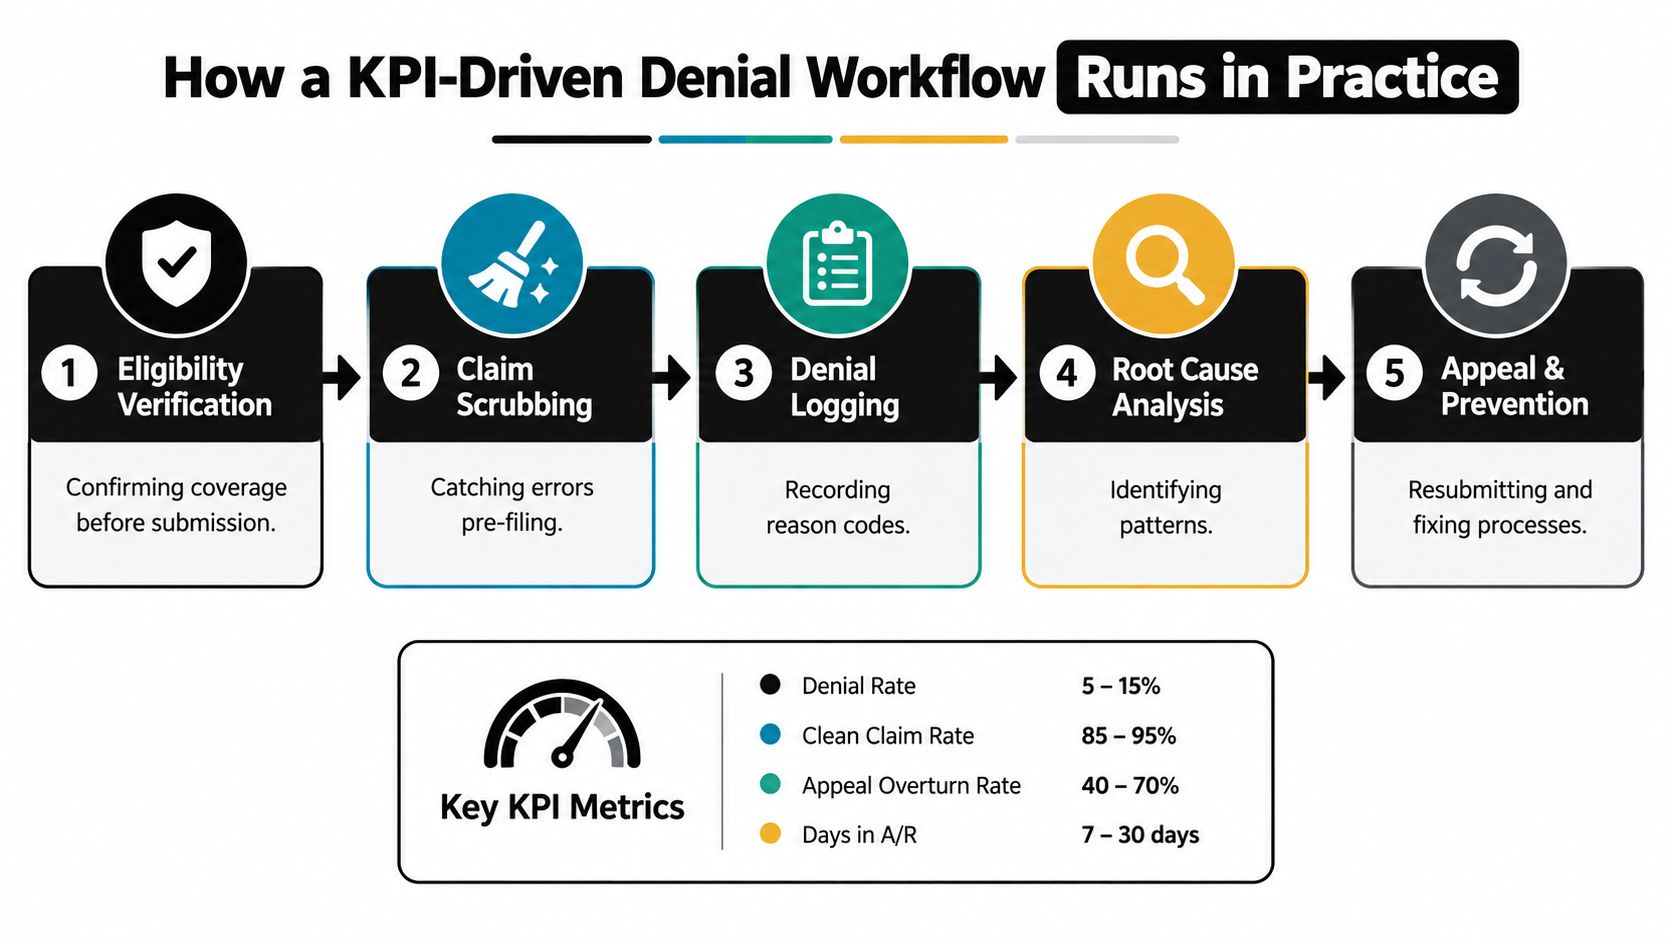
From clean claim to denial queue
The claim passes through pre-submission edits. Those edits should connect the code to documented clinical facts, authorization status, payer rules, provider enrollment, and timely-filing requirements. A generic scrubber may catch malformed data, but the operating team also needs specialty and payer context.
Suppose the payer denies the claim for an authorization issue. The denial analyst logs the claim, reason code, payer, service, provider, location, age, billed amount, expected allowed amount, and likely recovery path. The analyst then checks whether the payer's authorization record is wrong, whether the approval was absent, or whether scheduling submitted a service that exceeded the approved scope.
The team should route the claim according to cause and value:
- Correctable claim defect: Fix the data or coding issue, attach the required evidence, and resubmit.
- Payer processing error: Prepare a focused appeal showing the original claim, payer response, authorization record, clinical documentation, and applicable policy.
- Recurring workflow defect: Assign the issue to patient access, authorization, coding, documentation, credentialing, or billing for a prevention change.
- Low-probability or low-value recovery: Apply the organization's write-off policy after documenting the decision.
The feedback loop
The case isn't closed when staff submit a corrected claim. It closes when the payment posts, the appeal is decided, or the organization makes a documented write-off decision. The root cause should then update an edit, work instruction, payer rule, training item, or ownership report.
For an air-ambulance provider, the same model can include dispatch data, medical necessity records, mileage documentation, provider credentials, payer coverage, and out-of-network payment analysis. For a gastroenterology practice, it may focus on eligibility, authorization, procedure coding, pathology linkage, and documentation. The workflow changes by specialty, but the control logic remains consistent.
A denial queue is the output of the revenue cycle. It shouldn't be the only place where the organization manages revenue integrity.
Why More Appeals Is Not the Same as Better Denial Management
A full appeals queue can indicate diligence, but it can also indicate that prevention is failing. In 2023, HealthCare.gov consumers appealed only 376,508 of approximately 86 million denied in-network claims, which was less than 1% of denials. Insurers upheld 211,383 appeals, or 56%, according to KFF's analysis of claims denials and appeals.
The lesson isn't that appeals lack value. It's that appeal volume alone says very little about program quality. A team can submit more appeals because it has better prioritization, or because it is repeatedly correcting the same preventable registration or authorization defect.

Replace queue activity with recovery economics
A denial should enter an appeal decision process, not an automatic appeal process. The decision should consider:
- Recoverable value: What payment is realistically available if the claim succeeds?
- Evidence strength: Does the record support the service, coding, authorization, and payment position?
- Deadline risk: Can the team complete a compliant correction or appeal on time?
- Labor cost: How much staff and clinical time will the case require?
- Payer behavior: Does this payer routinely reverse the category, or does it rarely change its position?
- Escalation options: Is conventional appeal appropriate, or does the claim belong in an underpayment or IDR pathway?
Survey data from Experian Health adds an upstream warning. 41% of providers reported denial rates of at least 10%, 68% said submitting clean claims had become more difficult, and leading causes included missing or inaccurate data at 50%, authorization problems at 35%, and incomplete or inaccurate registration data at 32%, according to Experian Health's State of Claims survey release.
Those causes belong largely before the appeal queue. A stronger program reduces preventable denials, measures net recovery after labor cost, and sends fewer repeat defects downstream.
Where Denial Management Meets Underpayment Recovery and IDR
A claim can fail in two different ways. The payer can deny it, or the payer can process it but pay less than the provider believes is owed. Both outcomes consume revenue-cycle capacity, and both require reliable evidence.
That connection becomes especially important for No Surprises Act Independent Dispute Resolution. Certified IDR entities issued payment determinations in 1,145,039 disputes during the second half of 2025. Providers won approximately 85% of those determinations, and 62% were completed within 30 business days, according to CMS federal IDR supplemental background data.
The decision is not simply appeal or IDR
Conventional appeals generally fit claims where the payer denied a service, rejected supporting documentation, applied a coding rule incorrectly, or failed to process an authorization correctly. IDR may become relevant when an eligible out-of-network payment dispute falls within the applicable No Surprises Act process.
An emergency medicine group, anesthesia practice, or air-ambulance provider needs a decision framework that evaluates:
- Whether the dispute qualifies for the applicable IDR pathway.
- Whether the payment difference justifies the filing fee and staff effort.
- Whether the provider can assemble persuasive evidence.
- Whether the payer's position reflects a recurring underpayment pattern.
- Whether the expected award supports escalation after risk and administrative costs.
A clean claim improves both paths. The same documentation that helps a conventional appeal can strengthen an IDR submission, including service details, acuity, complexity, provider qualifications, market conditions, comparable rates, and the payment history relevant to the dispute.
Build evidence before the dispute
Underpayment recovery shouldn't begin when a team discovers a payment variance months later. The organization should preserve claim data, remittance details, contract or rate information, clinical evidence, authorization records, provider credentials, and payer correspondence as part of normal claim operations.
Medical underpayment recovery works best when it shares data and ownership with denial prevention. A disconnected IDR team may win individual disputes while upstream billing defects, incomplete documentation, and inconsistent evidence packaging continue to weaken future cases.
The integrated model is straightforward: engineer the claim for payment validity before submission, then preserve the evidence needed for compliant escalation when payment still falls short.
Building a Modern Denial Management Program
Start with ownership, not software. Map each denial category to the team that can prevent it, then give that team access to the evidence and dashboard needed to act.
Establish the operating controls
- Patient access: Own eligibility, registration accuracy, coordination of benefits, and financial clearance.
- Authorization: Maintain payer and service rules, approval records, expiration details, and mismatch checks.
- Coding and documentation: Link codes to clinical facts, required records, modifiers, medical necessity, and payer-specific edits.
- Credentialing: Track enrollment status by provider, payer, location, specialty, and effective date.
- Billing and claims: Control submission quality, attachments, claim status, timely filing, corrections, and duplicate prevention.
- Denial and appeal operations: Classify causes, protect deadlines, assemble evidence, prioritize recoverable value, and document outcomes.
- Underpayment and IDR operations: Review eligible disputes, calculate expected economics, preserve compliant evidence, and enforce payment decisions where appropriate.
The dashboard should show denial rate by volume and dollars, write-offs, days to appeal, days to resolution, overturn rate, preventable-denial rate, payer variation, and recurring causes. Leaders should be able to drill from an enterprise result to a payer, specialty, provider, procedure, location, and individual claim.
Evaluate tools and partners
Ask any internal team or vendor:
- Can the system distinguish a denial from an underpayment?
- Does it connect denial reason codes to operational root causes?
- Can staff prioritize by recoverable value, evidence strength, deadline, and labor cost?
- Does it show payer behavior over time?
- Can it preserve documentation for conventional appeals and IDR?
- Does each resolved case create a prevention action with an owner?
- Can the organization measure net recovery after operating cost?
RevGuard is one example of an integrated model. Its specialty-specific RCM workflows address eligibility, authorization, credentialing, documentation, coding, payer alignment, and pre-submission validation, while its IDR operations support evidence assembly and No Surprises Act dispute handling.
Pulling It All Into a Closed-Loop Operating Model
Denial management is a closed loop: prevent defects upstream, detect failures quickly, classify root causes, prioritize recoverable value, correct or appeal claims, escalate eligible underpayments through IDR, and return each outcome to the workflow that caused it. A cardiology group might convert repeated authorization denials into a payer-specific pre-service check, while a surgical practice might use an IDR outcome to tighten expected-payment and documentation rules.
Review the program through four questions:
- What is our preventable-denial rate?
- What is our net recovery after labor cost?
- Which payers repeat the same root cause?
- Which underpayments belong in IDR rather than conventional appeal?
A shared dashboard should connect those answers to payer, specialty, procedure, provider, location, and claim. Without that view, staff may clear follow-up tasks without reducing recurrence or identifying disputes worth pursuing.
RevGuard connects specialty-specific RCM, denial prevention, payer-behavior analytics, underpayment recovery, and No Surprises Act IDR operations in one revenue protection workflow. Visit RevGuard to assess upstream claim failures and determine which disputed payments may justify structured recovery downstream.